Figure 6.

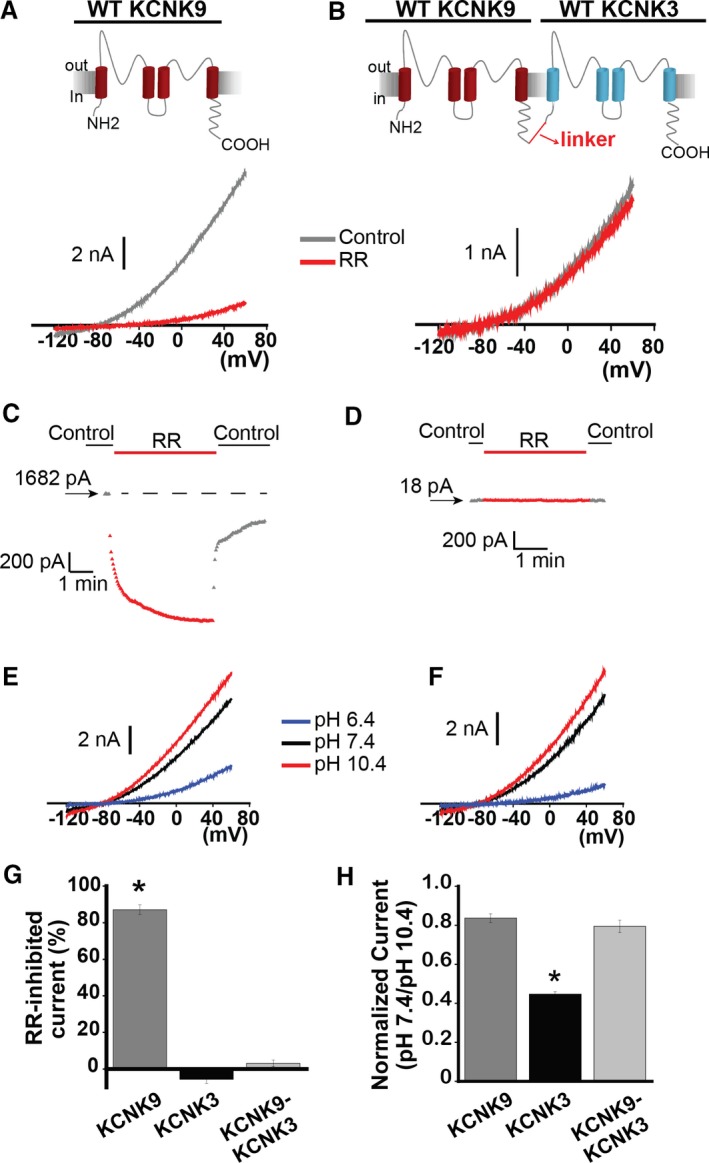
KCNK9 forms functional heterodimers with KCNK3. A, The effect of ruthenium red (RR) 10 μmol/L (red trace) on KCNK9 channels. Control trace (predrug, pH 7.4) shown in gray. B, The effect of RR 10 μmol/L (red trace) on KCNK9‐KCNK3 heterodimeric channels. Control trace (predrug, pH 7.4) shown in gray. C, Sample RR time course of action on KCNK9 in control and drug conditions, measured at −50 mV, from a starting current amplitude of 1682 pA indicated by the arrow. Horizontal dashed line is drawn at the starting level of current in control solution. D, Sample RR time course of action on KCNK9‐KCNK3 heterodimers in control and drug conditions, measured at −50 mV, from a starting current amplitude of 18 pA indicated by the arrow. E, Voltage clamp recording of KCNK9. F, Voltage clamp recording of KCNK9‐KCNK3. E and F, sample current traces at pH 6.4 (blue), 7.4 (black), and 10.4 (red) are shown. G, Summary of RR's effect on KCNK9, KCNK3, and KCNK9‐KCNK3, measured by percent‐inhibited current at −50 mV (n=5–8 cells per condition). H, Summary of mean current at pH 7.4 normalized to current at pH 10.4, measured at 60 mV, for KCNK9, KCNK3, and KCNK9‐KCNK3 (n=10–25 cells per condition). Bar graphs show mean±SEM. *P<0.05 by the paired Student t test for the comparison of control vs RR (G), and * indicates significance by 1‐way ANOVA (P<0.05) and post hoc Tukey test for the comparison of KCNK9, KCNK3, and KCNK9‐KCNK3 (H).
