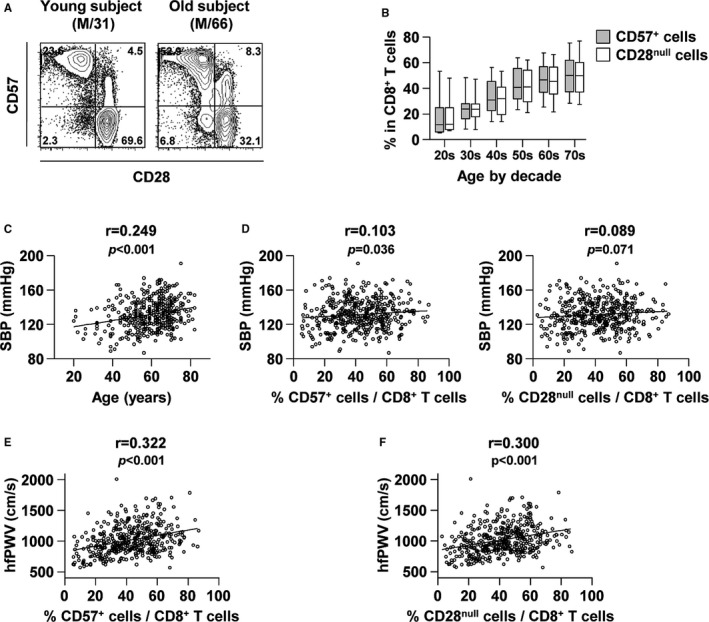
Figure 1.

The significance of the frequency of senescent CD8+ T cells in blood pressure and PWV. Immunophenotyping of peripheral blood mononuclear cells obtained from 415 individuals was performed. A, Representative flow cytometry plots are presented for CD57 and CD28 expression in CD8+ T cells in a young (left) and an old subject (right). B, The frequency of CD57+ (gray) or CD28null (white) cells in CD8+ T cells is plotted against age. C, Pearson's correlation scatterplot of SBP and the age of all participants. D, Pearson's correlation scatterplot of SBP and the frequency of CD57+ (left) or CD28null (right) cells in CD8+ T cells. E and F, Pearson's correlation presented by plotting hfPWV against the frequency of CD57+ (E) or CD28null (F) cells in CD8+ T cells of the overall population. hfPWV indicates heart‐femoral pulse wave velocity; PWV, pulse wave velocity; SBP, systolic blood pressure.
