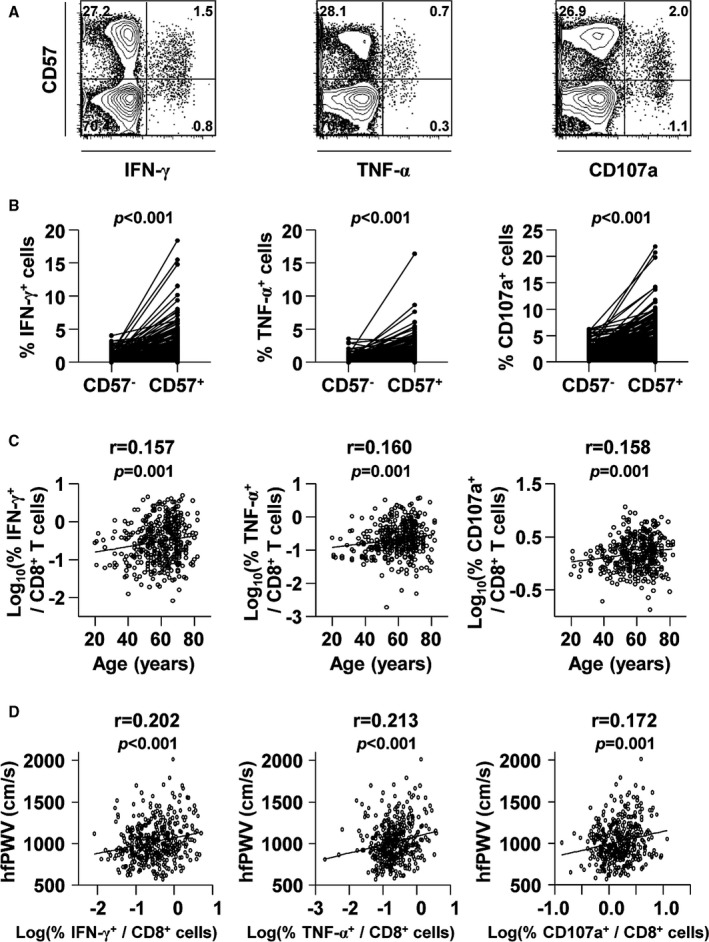
Figure 2.

The significance of cytomegalovirus pp65‐specific CD8+ T‐cell responses in the CD57+ population and PWV. Peripheral blood mononuclear cells were stimulated with cytomegalovirus pp65 overlapping peptides, and intracellular staining for IFN‐γ, TNF‐α, and CD107a was performed. A, Representative flow cytometry plots are presented for IFN‐γ and TNF‐α secretion and for CD107a expression in the CD8+ T‐cell populations. B, The frequencies of cytomegalovirus pp65‐specific IFN‐γ‐, TNF‐α‐, and CD107a‐expressing cells were compared between CD8+CD57+ and CD8+CD57− T‐cell populations. Cytomegalovirus pp65‐specific responses were more frequently observed in CD8+CD57+ T cells than in the CD8+CD57− population. The P value was calculated using the paired t test. C, Pearson's correlation presented as a scatterplot of age and the frequency of cytomegalovirus pp65‐specific IFN‐γ‐, TNF‐α‐, and CD107a‐expressing cells (log‐transformed) in CD8+ T cells. D, Pearson's correlation presented as a plot of hfPWV against the frequency of cytomegalovirus pp65‐specific IFN‐γ‐, TNF‐α‐, and CD107a‐expressing cells (log‐transformed) in CD8+ T cells of the overall population. hfPWV indicates heart‐femoral pulse wave velocity; IFN‐γ, interferon‐ γ; TNF‐α, tumor necrosis factor‐ α.
