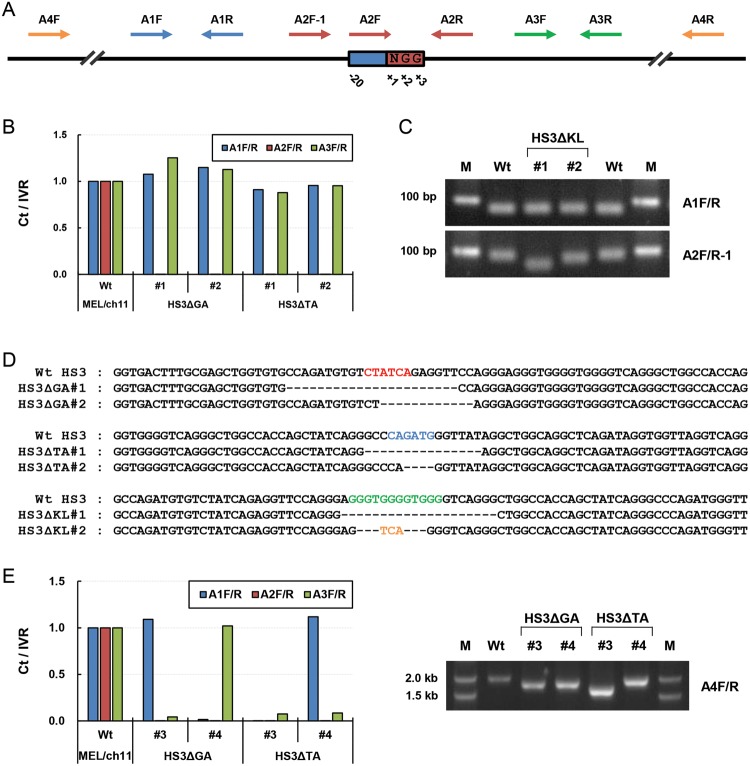
Figure 2. Screening of mutations generated by the CRISPR/spCas9 system.
(A) The locations of primer sets for PCR are presented on DNA with respect to the target sequences of sgRNA. The target sequences are 20 nts in length, and ‘NGG’ nucleotides acting as PAMs are numbered as ‘+1’, ‘+2’, and ‘+3’. One primer in A2 amplicon (red arrows) locates on the target sequences, and A2R-1 primer is on next to the target sequences. A1 (blue arrows) and A3 primers (green arrows) locate in both flanking regions of the target sequences. A4F/R (yellow arrows) primers amplify large region including A1, A2, and A3 amplicons. (B) Genomic DNA from clones targetted by the CRISPR/spCas9 system, was amplified by qPCR using the three primer sets, A1, A2, and A3. PCR product amounts were compared using IVR amplicon for intervening region between the LCR and ε-globin gene as an internal control and then normalized compared with amounts in wild-type (Wt) MEL/ch11 cells. (C) In HS3ΔKL clones, PCR products amplified by A1F/R and A2F/R-1 primers were visualized on an agarose gel, M is the DNA marker. (D) DNA sequences in the LCR HS3 are presented for Wt cells and clones with GATA-1, TAL1, or KLF1 motif deletions. The binding motifs of transcription factors are marked by colored bases as described in Figure 1. Black dashes represent deleted nucleotides and yellow bases are inserted nucleotides. (E) Genomic DNA of clones was amplified and quantitated as described above. PCR products amplified by A4F/R primers were visualized in an agarose gel.

