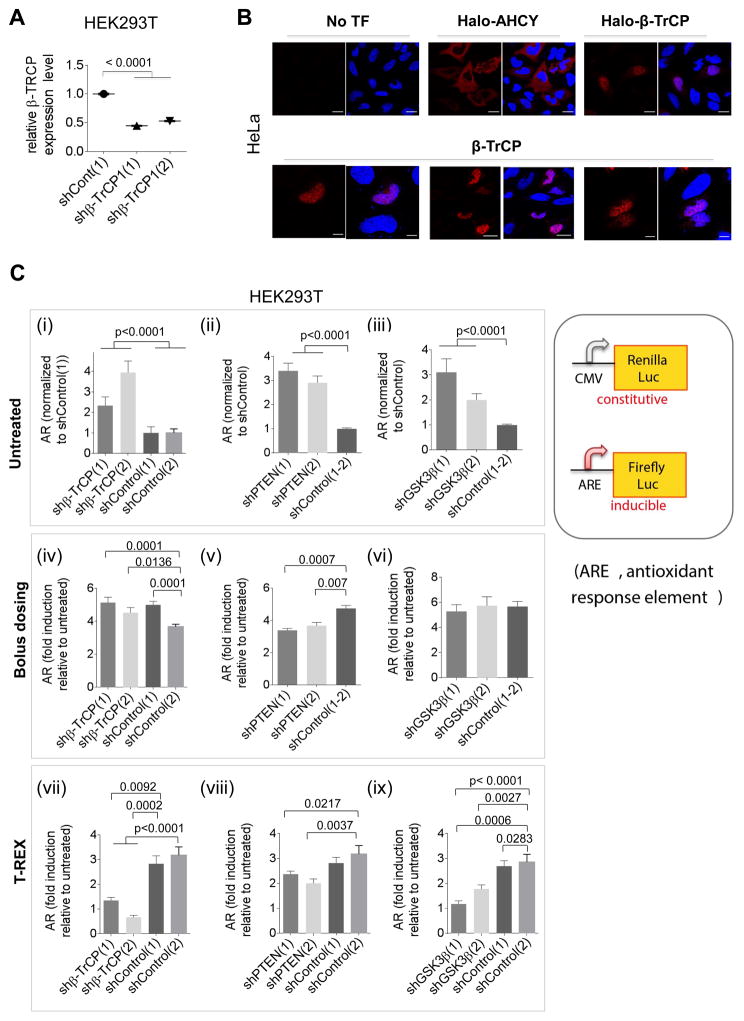
Figure 2. Nuclear β-TrCP1 is necessary for Keap1-HNEylation-specific AR upregulation; bolus HNE exposure masks this requirement.
(A) β-TrCP1 knockdown efficiency in two different shRNA-expressing lines from immunofluorescence (IF). Also see Figure S2. (B) Top panels: IF imaging in HeLa [anti-Halo (Table S1)] shows nuclear localization of Halo-β-TrCP1 as previously reported for β-TrCP1 (Seo, et al., 2009). AHCY—a known cytosolic protein—provides contrast (Hershfield, et al., 1985). Lower panels: Similar results were found with overexpression of untagged β-TrCP1 and IF imaging using β-TrCP antibody. Scale bar, 20 βm. (C) Effects of knockdowns, compared to non-targeted-shRNA controls, on the relative magnitude of Keap1-alkylation-specific AR. Note: for untreated [(i), (ii), (iii)], all signals are normalized to shControl; for other data [(iv)–(ix)], each bar is normalized to its respective value in the untreated set; the value in the untreated set is unity. Results from: untreated HEK293T cells [(i)–(iii); control cells set to 1]; bolus HNE dosing (25 βM HNE, 18 h) [(iv)–(vi); each relative to respective untreated set to 1]; T-REX (Keap1-specific-HNEyation) in cells [(vii)–(ix); each relative to respective untreated set to 1]. Inset: luciferase AR-reporters. The ratio of firefly (ARE) over Renilla (constitutive, CMV) gives AR. Data present Mean±s.d. with each bar graph from n>3 independent biological replicates.

