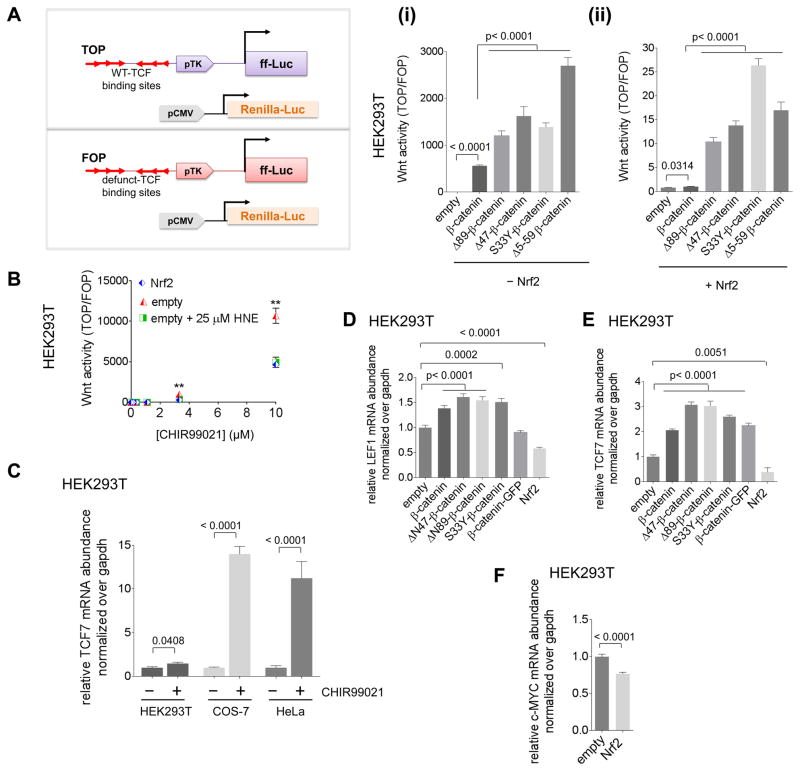
Figure 4. Dose response relationship between Wnt signaling and AR signaling.
(A) Inset: Schematic of the TOP/FOP assay for Wnt activity: one set of cells is transfected with the TOP reporter, CMV::Renilla luciferase, empty vector [for 4A(i)], and indicated additional plasmid(s) as indicated; and a second set of cells is transfected with the FOP reporter, CMV::Renilla luciferase, Nrf2 plasmid [for 4A(ii)], and additional plasmid(s) as indicated. After 2 days, Wnt signaling was measured. Note: axes for 4A(i) and 4A(ii) are different. [The TOP construct contains 3 Wnt-specific binding sites for TCF (T-cell factor) transcription factors and the firefly (ff) luciferase (Luc) reporter under control of a minimal promoter. The FOP construct is identical to the TOP reporter but has the 3 TCF-binding sites mutated, rendering it inactive]. (B) At 1-day post-transfection of HEK293T with TOP or FOP, empty vector or Nrf2, and CMV::Renilla, samples were exposed to varying concentrations of CHIR99021 (with or without HNE) and after 24 h, Wnt activity was measured [Nrf2 (blue) and (empty vector + 25 μM HNE) (green) are coincidental for all concentrations of CHIR99021]. (C) The indicated cells were treated with either DMSO or CHIR99021 (10 μM) for 24 h, then TCF7 mRNA was measured using qRT-PCR. (D–F) HEK293T cells were transfected with plasmids encoding the indicated transgene. After 48 h, LEF1 (D), TCF7 (E), and C-MYC (F) mRNA were measured using qRT-PCR. Data present Mean ± s.e.m. with each bar graph from n>3 independent biological replicates.

