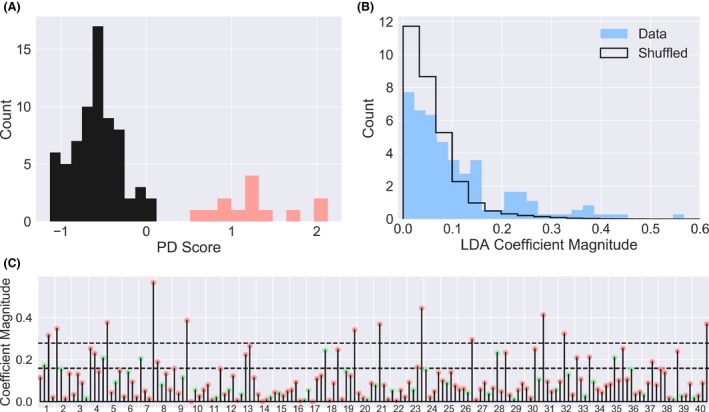
Figure 3.

Specific incorrect responses inform PD diagnosis. (A) A classifier fit to the entire nondemented subject sample and mapped onto the fit's first principal dimension distinguishes PD (red) from control (black) subjects. (B) The coefficients (corresponding to the informativeness of each possible response to each UPSIT question) of the classifier have a distribution with a longer tail than coefficients obtained using the same classifier applied to the same data with diagnostic labels shuffled. (C) All 160 coefficients (4 per UPSIT question) are plotted, with green corresponding to the correct answer to each question, and red to each of the three incorrect answers. The 95th and 99th percentiles of the shuffled distribution are shown as dashed lines.
