
Figure3.
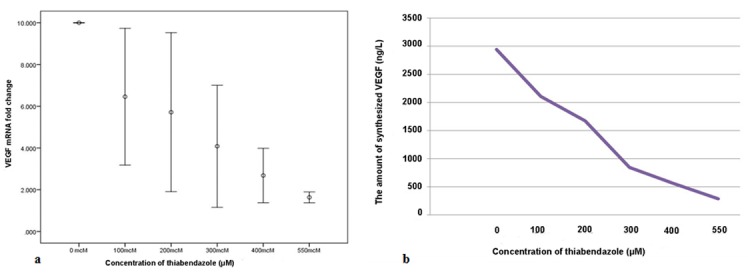
a: Comparison of VEGF mRNA expression in presence of different concentrations of TBZ at 48 hours, b: Comparison of VEGF production by HN5 cells in presence of different concentrations of TBZ
Official websites use .gov
A
.gov website belongs to an official
government organization in the United States.
Secure .gov websites use HTTPS
A lock (
) or https:// means you've safely
connected to the .gov website. Share sensitive
information only on official, secure websites.
a: Comparison of VEGF mRNA expression in presence of different concentrations of TBZ at 48 hours, b: Comparison of VEGF production by HN5 cells in presence of different concentrations of TBZ