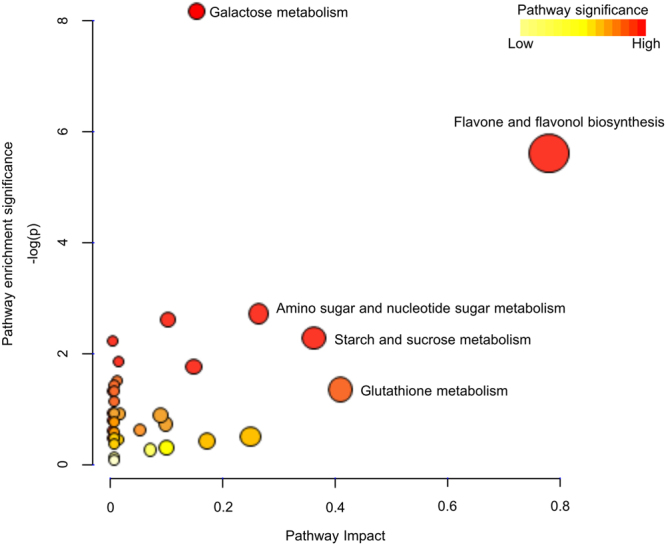
Figure 4.

Metabolic pathways affected by ABA treatment in guard cells revealed by pathway analysis. x axis represents the impact of the identified metabolites on the indicated pathway. y axis indicates the extent to which the designated pathway is enriched in the identified metabolites. Values were ascertained from MetaboAnalyst. Circle colors (see color scale for reference) indicate pathway enrichment significance. Circle size indicates pathway impact.
