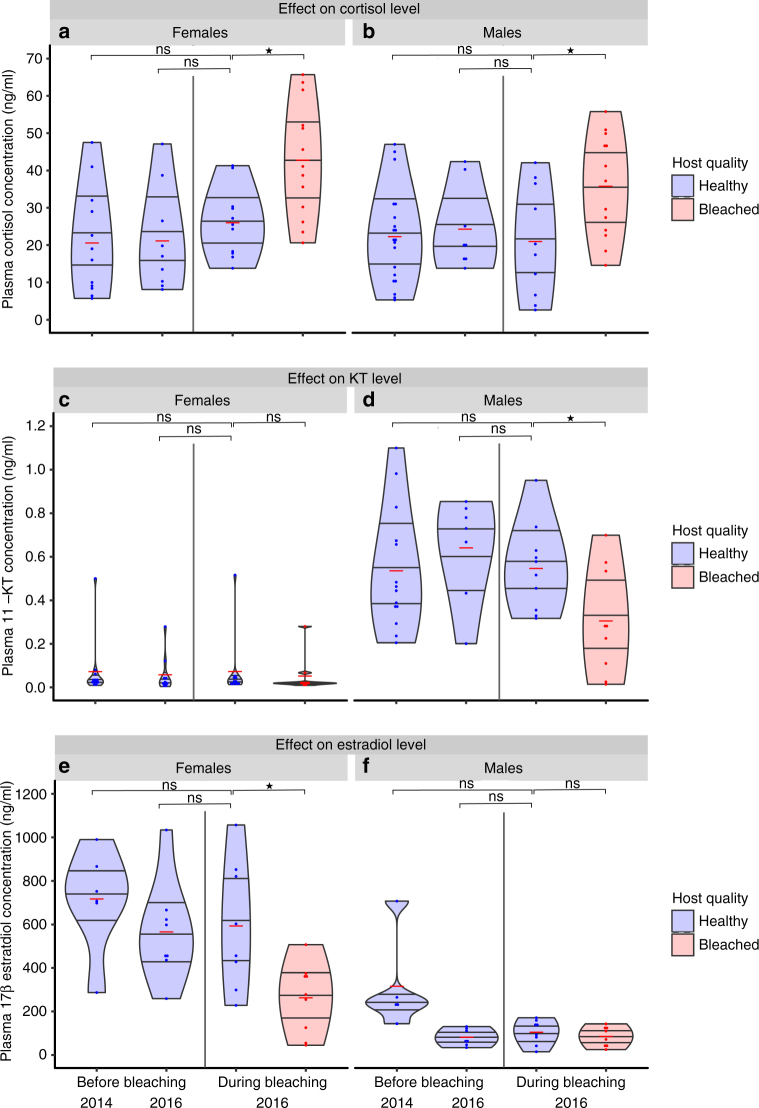
Fig. 3.
Stress and reproductive hormones before and during bleaching events. Effect of exposure to warming-induced anemone bleaching (red violin plots) on wild, free-living adult anemonefish plasma hormone concentrations compared with those from adults exposed to unbleached hosts (blue violin plots) between three periods: twice before (2014 n = 12/20; 2016 n = 9/8 for females/males, respectively) and once during the bleaching event (unbleached n = 11/10; bleached n = 13/13 for females/males, respectively). Hormonal measures were taken from an additional 39 anemonefish pairs that were not monitored for spawning every 2 days. a Female cortisol (Linear mixed model (LMM) F 3,41 = 7.309, P < 0.001). b Male cortisol (LMM F 3,47 = 3.464, P = 0.023). c Female 11-KT (LMM F 3,38 = 0.077, P = 0.972). d Male 11-KT (LMM F 3,36 = 4.460, P = 0.010). e Female 17β-estradiol (LMM F 2,27 = 7.840, P = 0.001). f Male 17β-estradiol (LMM F 2,23 = 2.986, P = 0.052). Violin plots show the full distribution of the data with the inner part showing all sample points (blue dots), the median (red line), and the interquartile range overlaid by the kernel density estimation. Non-significance is denoted by “ns” and statistical significance is denoted by *P < 0.05

