Figure 4.
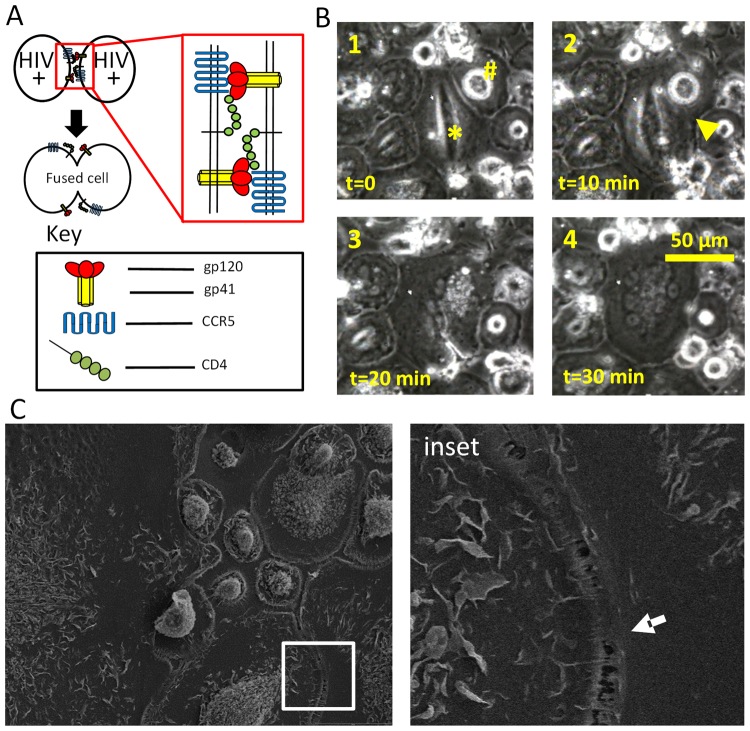
Fused HIV-infected macrophages are generated by cell-to-cell fusion and not by phagocytosis of dying cells. (A) Our proposed model of cell-to-cell fusion of neighboring HIV-infected macrophages. Top two circles represent neighboring macrophages infected with HIV and containing HIV Env proteins gp120/gp41 (red bulbs/yellow stalks) in proximity with endogenous CD4 and CCR5 (green bulbs, blue wave). Red outlined insert represents moment just before cell-to-cell fusion in which all components necessary are present on the neighboring cell membrane. The dark arrow represents fusion steps that result in cell-to-cell fusion, where the product of fusion is represented just below the arrow. (B) Representative fusion event captured by time-lapse imaging. HIV-infected macrophages were maintained in 60 mm culture dishes until cell to cell fusion was evident by light microscopy, then transferred to an incubated microscope with time-lapse capabilities. In this typical case, cell to cell fusion was captured after 3 days post infection, and fusion of two neighboring cells occurred in approximately 30 minutes. The fusion of two cells is denoted by “*” and “#”, and frames presented identify cellular events that are consistent with cell-to-cell fusion. Frame 1 depicts neighboring cells before fusion. Frame 2 illustrates the fusion point between cells (yellow arrow). Note the cell membrane between the two cells is nearly indistinguishable. Frame 3 illustrates the point at which the borders of the two neighboring cells are indistinguishable, with a southeastern invagination the only indicator that the new cell was once part of a pair. Frame 4 depicts the completion of the fusion event. Note that the size of the resultant cell is nearly the additive size of the original cells marked “*” and “#” from frame 1. (C) Scanning electron micrograph of melding cytoplasm between neighboring macrophages in HIV treated cultures.

