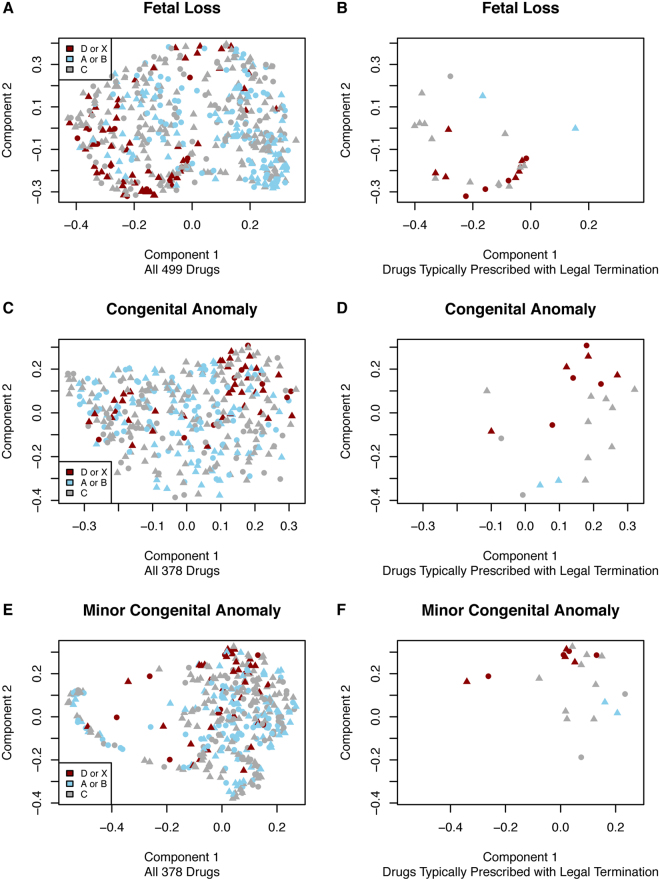
Figure 1.
Multi-Dimensional Scaling (MDS) Component Plots for: Fetal Loss, Congenital Anomaly and Minor Congenital Anomaly. The three subplots on the left hand side of the figure (A,C,E) contain all drugs while on the right hand side of the figure (B,D,F) contain only drugs typically prescribed with legal termination. Red drugs are those shown as category D or X, blue drugs are category A or B while category C drugs are shown as grey. For all subplots, triangles indicate that the drug affected a protein encoded by a known Mendelian gene whereas circles indicate that the drug did not affect a protein encoded by a known Mendelian gene. For congenital anomalies, the proportion with an anomaly for each of the 5 exposure periods (2 pre-conception and 3 trimesters) were included as features. For fetal loss, only the 2 pre-conception periods and the first trimester were included.

