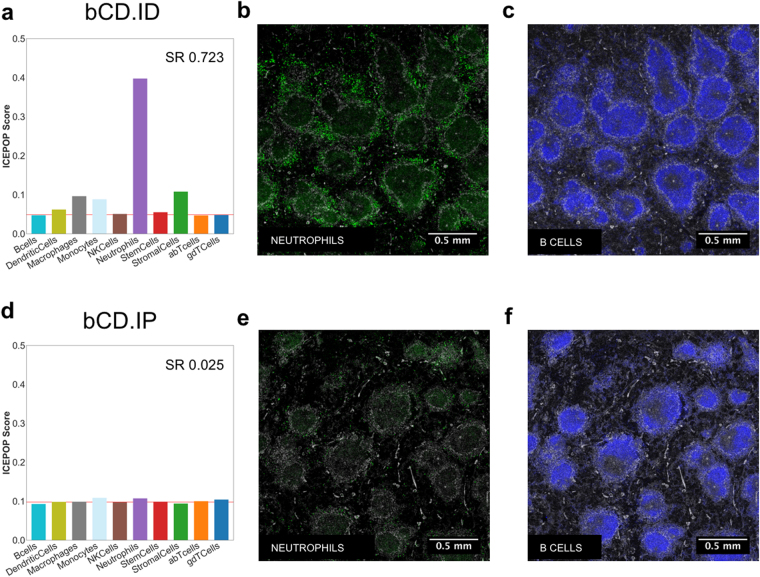
Figure 2.
Immune cell population responses in the GSE63332 dataset. ICEPOP score (y-axis), sample response (SR) (inlet), and cell type response threshold (CRT) (horizontal red line) are shown in the bar graph of (a) ID and (d) IP bCD-treated spleens. Immunofluorescent staining of the spleen section via ID (b,c) or IP (d,f) administration of bCD for Neutrophil (b,e), and B cells (c,f) markers. Activated neutrophils is indicated by a stronger green staining in (b) compared with (f).

