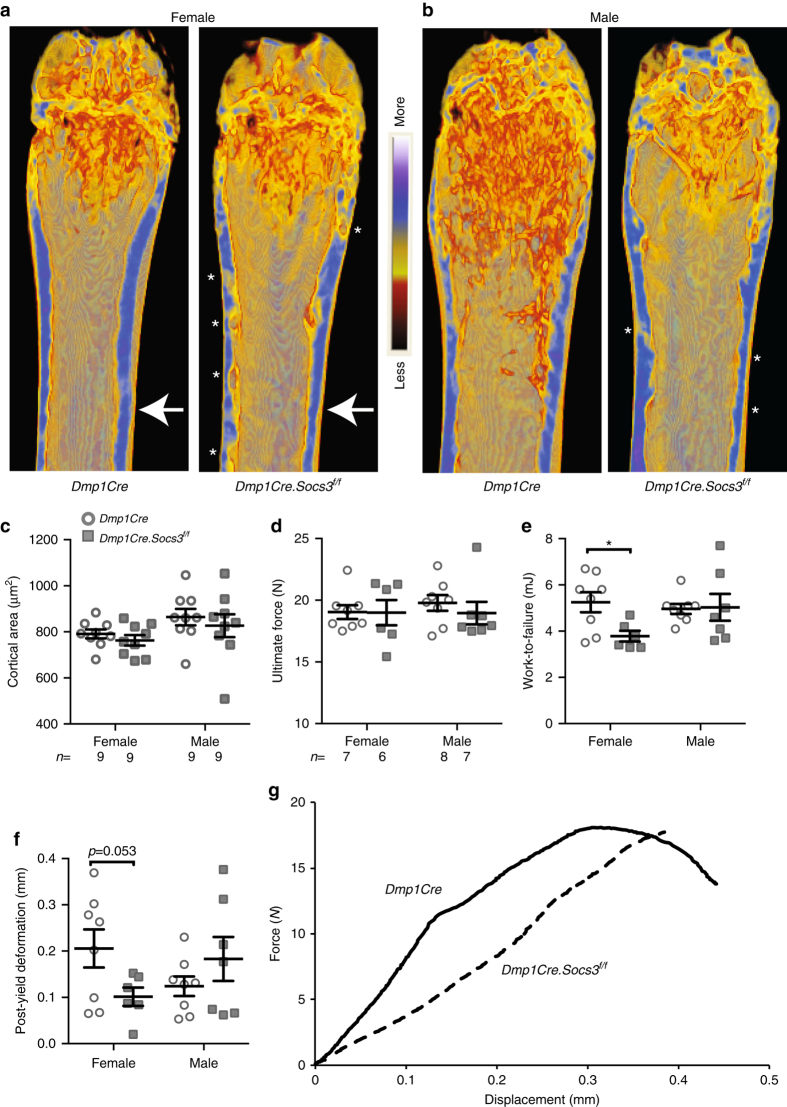
Fig. 4.
Sex-specific delay in corticalization in female Dmp1Cre.Socs3f/f mice leads to reduced bone strength at 26 weeks of age. a, b Representative coronal cross sections of female (a) and male (b) femora showing levels of mineralization (scale at the center of the images shows red = less mineralized, while blue = more mineralized); arrows indicate approximate location of load during 3 point-bending; asterisks alongside cortical bone denote regions of poor cortical consolidation. c Cortical bone area in 26-week-old male and female Dmp1Cre (open circles) and Dmp1Cre.Socs3 f/f (gray squares) femora; values are mean ± SEM, n is shown below the graph. d–f Results of 3 point-bending tests of femora from 26-week-old male and female Dmp1Cre (open circles) and Dmp1Cre.Socs3 f/f (gray squares) femora; values are mean ± SEM, n is shown below graph (d). *p < 0.05; **p < 0.01 vs Dmp1Cre of the same sex by two-way ANOVA with Sidak post-hoc test. g Representative load-displacement curves of female Dmp1Cre (solid line) and Dmp1Cre.Socs3 f/f (dashed line) femora

