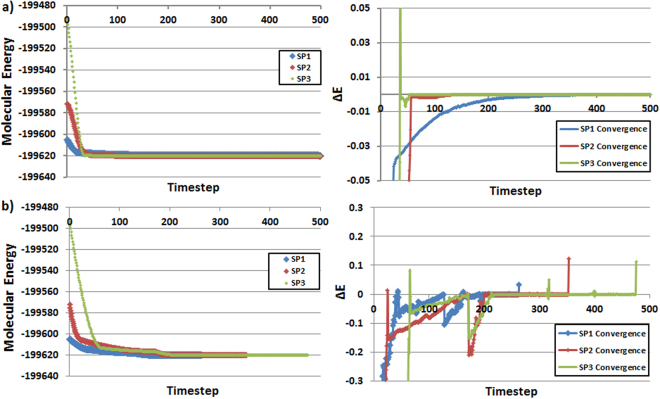
Figure 4.
T500 molecular model geometry optimization trajectory steps with SP1 (blue), SP2 (red) and SP3 (green) starting points: (a) Set 1 (0 K and 1 fs timestep) truncated at 500 steps where the energy fluctuation is <0.0001 kJ mol−1 and (b) Set 3 (GC and 1 fs timestep) with no truncation. The x-axis marks the timestep number. In the left panels, the y-axes denote molecular energy; in the right panels the y-axes denote ΔE (current energy – previous energy). All energies are in kJ mol−1.

