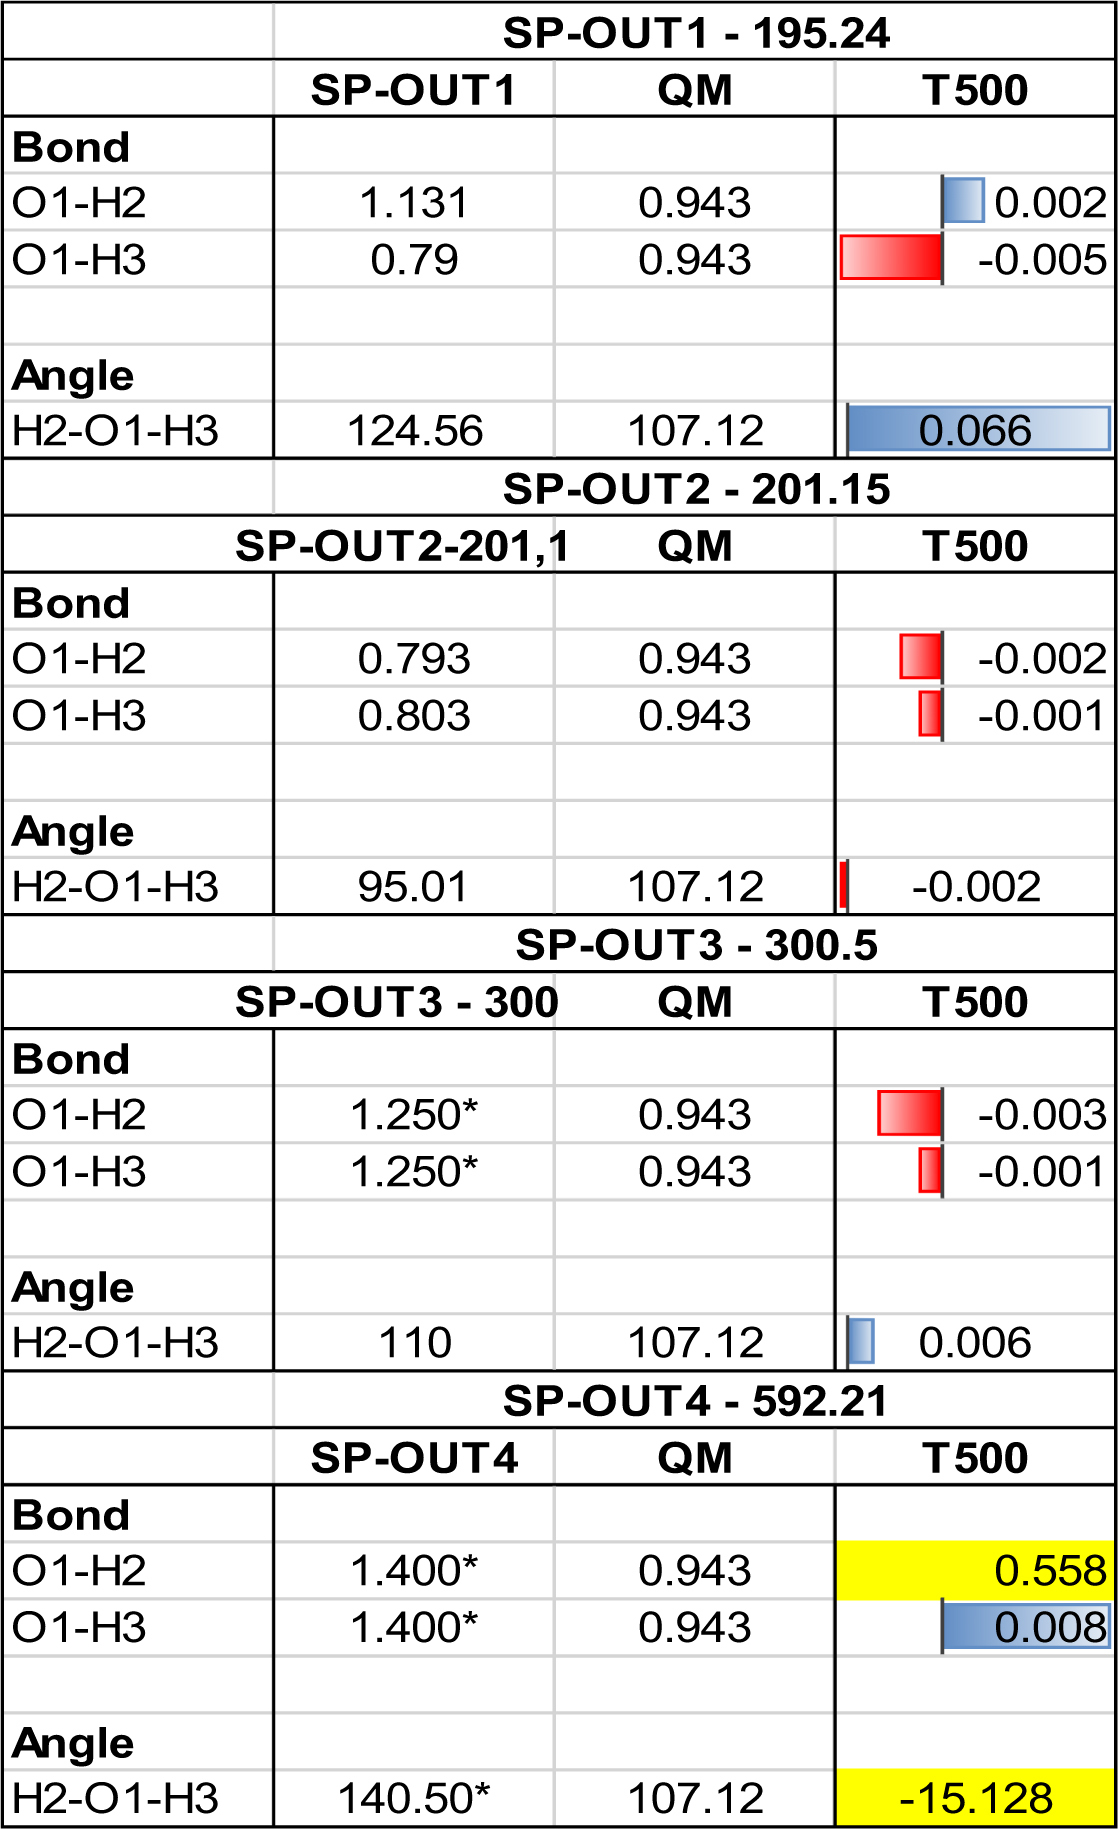
Table 4.
Optimized geometrical data for each of the four SP-OUT runs for the most energetically stable parameter set (Set 1). All runs are completed using the T500 model. Optimized values are reported as relative to the QM, i.e. bond distances and angles are plotted as “relative data” bars where red indicates a lower value, blue a higher value. The magnitude of each bar is marked by its length, normalized using all resulting bond distances across all three SPs. The largest bar (blue, SP-OUT4, O1-H3) is set to one unit of length. The angles are treated similarly, with the unit length bar being “red, SP-OUT1”. Values outside the training range are highlighted in yellow and taken out of the data bars calculations.