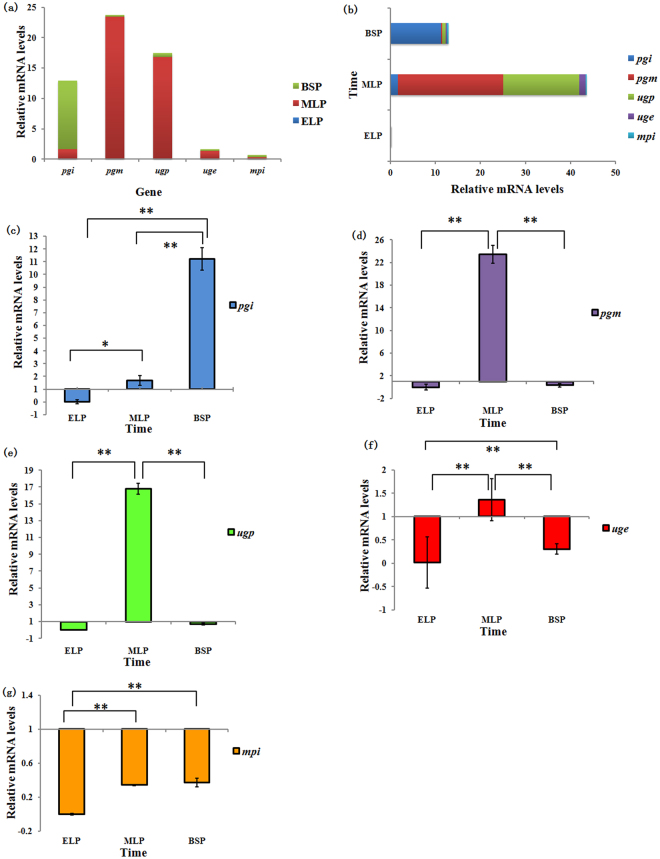
Figure 6.
The relative expression levels of each gene at different time points (a: the relative expression of one gene at different time points; b: the relative expression of different genes at one time point; c: the relative expression of pgi; d: the relative expression of pgm; e: the relative expression of ugp; f: the relative expression of uge; g: the relative expression of mpi). Values are expressed as the mean ± standard deviation (S.D.) (n = 3). *P < 0.05, **P < 0.01 compared to another time point.

