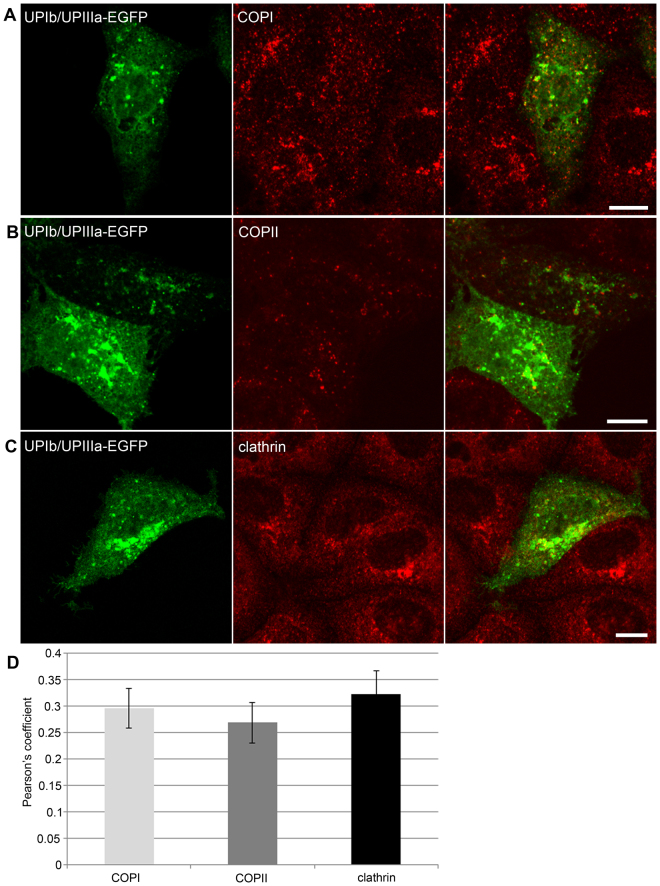
Figure 6.
Distribution of UPIb/UPIIIa-EGFP signal and COPI, COPII or clathrin signal in MDCK cells. After synchronization of protein released from GA, MDCK cells were treated with tannic acid to prevent fusion of UPIb/UPIIIa-EGFP positive vesicles with the plasma membrane. (A–C) Representative images of the localization of UPIb/UPIIIa-EGFP (green) and other vesicle markers (red), as indicated. (D) Quantitative analyses of the localization of UPIb/UPIIIa-EGFP (green) and other vesicle markers show moderate co-localization of UPIb/UPIIIa-EGFP and COPI, COPII or clathrin. The degree of co-localization from the Pearson’s value correlation coefficients was categorized according to69 as very strong (0.85 to 1.0), strong (0.49 to 0.84), moderate (0.1 to 0.48), weak (−0.26 to 0.09), and very weak (−1 to −0.27). Error bars are the standard errors of the means (n = 3). Bars: 10 µm (A–C).

