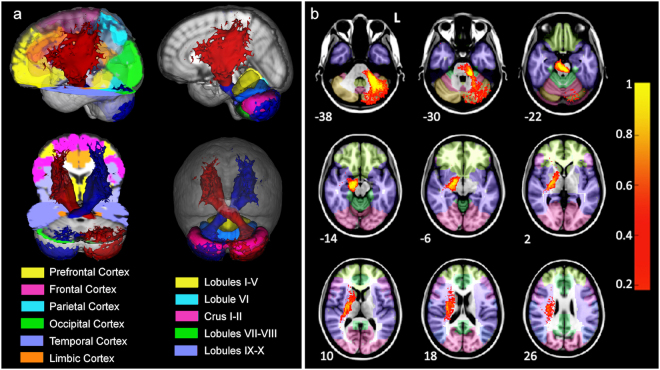
Figure 3.
Extension of the cortico-ponto-cerebellar pathways averaged across all subjects, normalised to MNI space and thresholded to include voxels common to at least 20% of subjects. (a) Tridimensional view overlaid on cerebral (left panel) and cerebellar (right panel) anatomical parcellations. Temporal (violet) and frontal (pink) lobes are the areas mainly reached both by the left (blue) and right (red) seeded pathways. In the cerebellum, lateral crus I-II (pink) and lobules VII-VIII (green) are areas with the greatest density of streamlines. (b) Axial sections of the left pathway (red-yellow) overlaid on the same anatomical templates. Z coordinates are reported for each slice (mm). L = left side of the brain. The scale on the right represents the mean pathway coloured in terms of percentage of overlapping subjects (1 = 100%).

