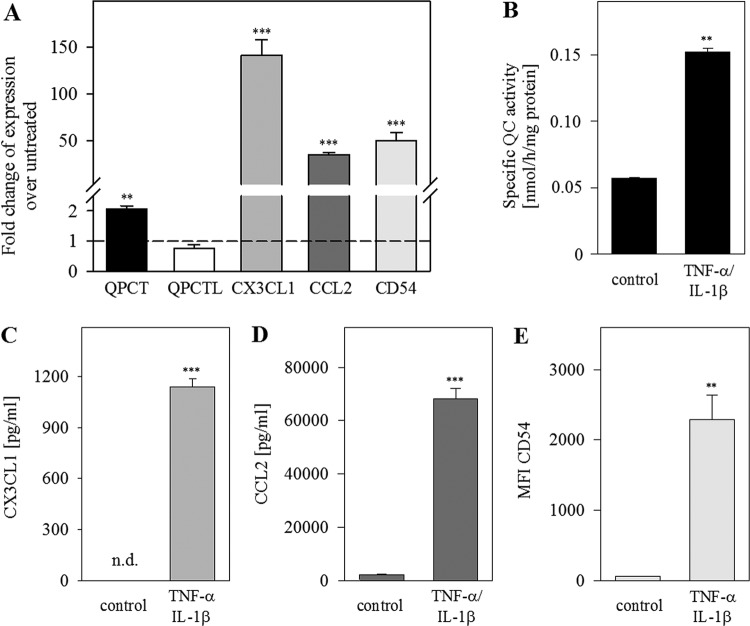
Figure 2. Co-regulation of QC and its substrates CCL2 and CX3CL1 upon stimulation with TNF-α/IL-1β in HUVECs.
HUVECs were treated with TNF-α/IL-1β (10 ng/ml) for 24 h. (A) qPCR analysis was performed for the indicated genes. (B) Specific QC activity in conditioned medium was measured by HPLC and normalized to protein concentration. The basal activity of the culture medium without cells was subtracted. (C) CX3CL1 was quantified via immunoassay (MILLIPLEX MAP). (D) CCL2 concentration in supernatant was measured with specific human CCL2 ELISA. (E) Surface expression of CD54 was analysed by flow cytometry. Data from three independent experiments on different days are presented as mean ± S.D. (**P<0.01, ***P<0.001. Abbreviation: n.d., not detectable).

