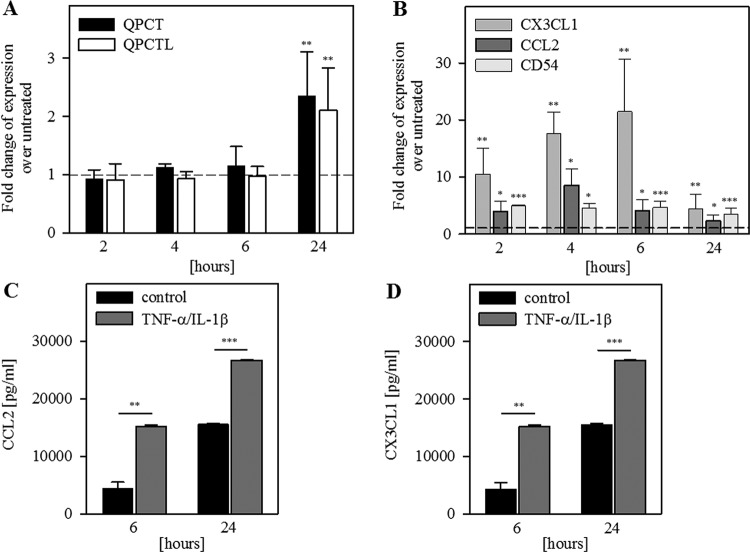
Figure 3. Co-regulation of QC and its substrates CCL2 and CX3CL1 in HCASMCs is time dependent.
HCASMCs were serum-starved for 24 h and then treated with TNF-α/IL-1β (10 ng/ml) for the indicated times. qPCR was performed for the indicated genes (A) QPCT, QPCTL; (B) CX3CL1, CCL2, ICAM1/CD54. Data from eight independent experiments (cells from two different donors) are expressed as fold-change over untreated and shown as mean ± S.D. (C) CCL2 was detected with immunoassay (MILLIPLEX MAP); (D) CX3CL1 was quantified with immunoassay (MILLIPLEX MAP); Data from three experiments performed in duplicates are shown as mean ± S.D. (*P< 0.05, **P<0.01, ***P<0.001).

