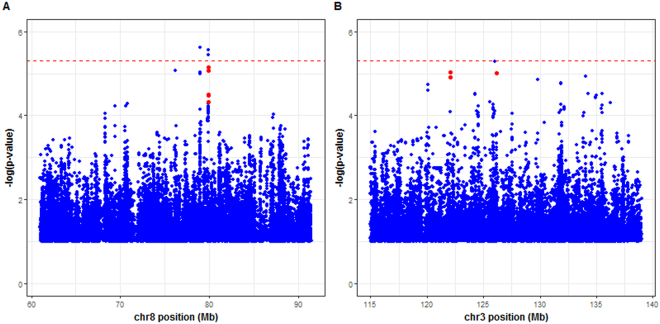
Figure 1.
Manhattan plots displaying genetic association results for 489 related individuals from the Val-de-Marne sample using a linear mixed model approach implemented in GEMMA software (A) The IFNγ-BCG phenotype across 117354 SNPs in the chromosome 8 region from 61 Mb to 91.5 Mb, and (B) The IFNγ-ESAT6bcg phenotype across 93218 SNPs in the chromosome 3 region from 115 Mb to 139 Mb. The −log 10 value of the minimum p-value obtained in the additive, dominant and recessive tests, is displayed against chromosomal position, in Mb, in the chromosomal region concerned. A horizontal line at a −log10 p value of 5 × 10⁻⁶ indicates the significance threshold, and points in red represent the SNPs belonging to clusters investigated in more detail after replication analyses.

