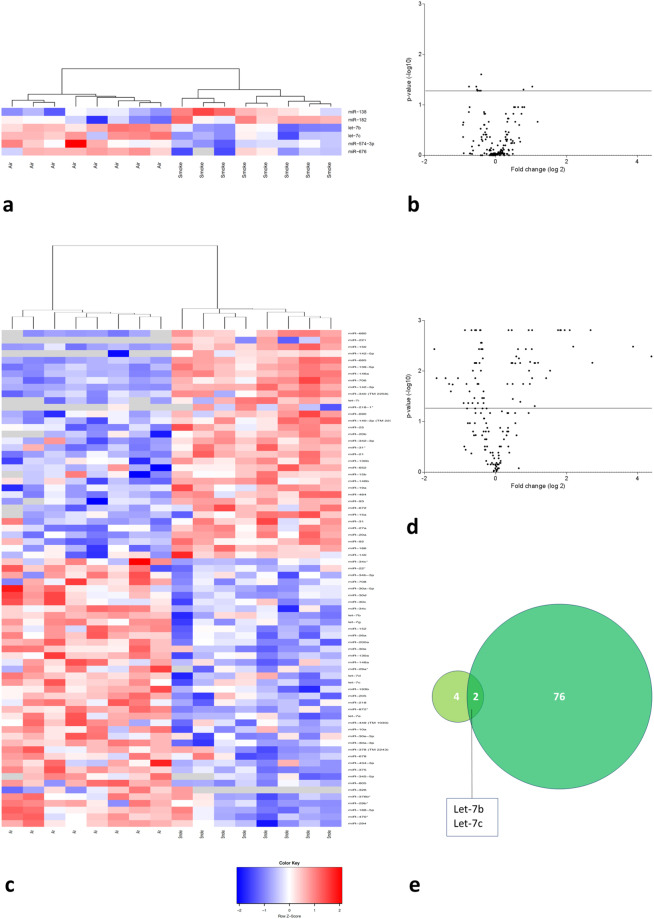
Figure 2.
miRNA expression profiling in cell-free BAL supernatant of air- and CS-exposed mice. Volcano plots showing the differential miRNA expression (in fold change on the x-axis) and significance level (-log10-adjusted p-value on y-axis). The detected miRNAs are plotted as black dots. The horizontal line indicates the 0.05 significance level. In the heatmaps, only the significantly differentially expressed miRNAs are represented. These were hierarchically clustered across the air- and smoke-exposed groups. Each row represents a miRNA and each column represents a murine BAL supernatant sample. The color code indicates the expression level: red = higher expression following CS exposure, blue = lower expression, grey = miRNA was not detected (“NA” values). (a) Heatmap showing the differentially expressed miRNAs in murine BAL supernatant following subacute (4 weeks) air or CS exposure. (b) Volcano plot representing the miRNA profiling data in BAL supernatant following subacute CS exposure compared to air exposure. (c) Heatmap showing the differentially expressed miRNAs in murine BAL supernatant following chronic (24 weeks) air or CS exposure. (d) Volcano plot representing the miRNA profiling data in BAL supernatant following chronic CS exposure versus air exposure. (e) Overlap in differentially expressed miRNAs in murine BAL supernatant between subacute and chronic CS exposure compared to air exposure. Volcano plots with annotated miRNAs can be found in the online supplement (Figure S2).

