Fig. 5.
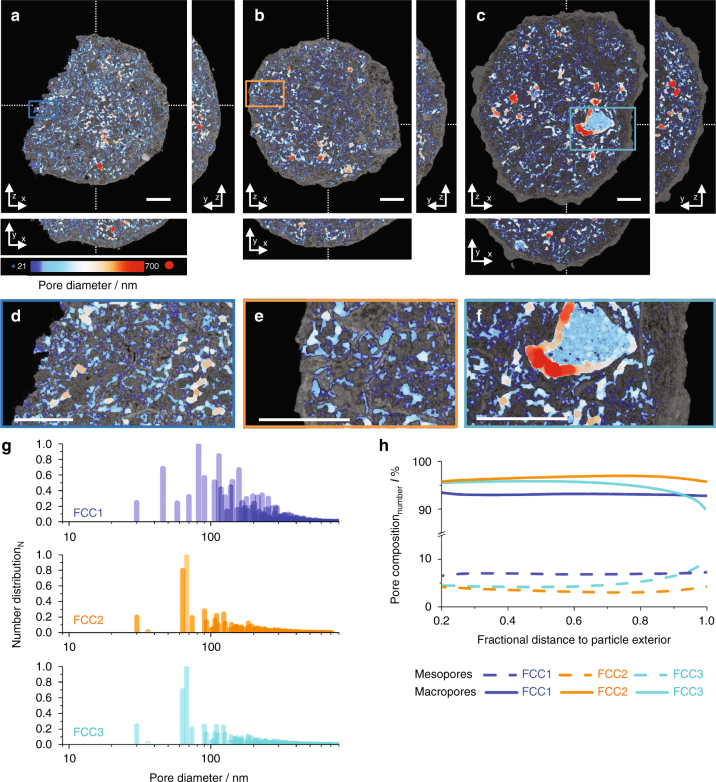
Pore network and pore size distribution analysis. Calculated thickness or pore diameter maps of FCC1, FCC2, and FCC3 are presented in a–c, respectively. Presented are bottom up (z–x) and orthogonal views (y–z, y–x). Cutting planes are represented by dotted lines. Orthoslices are presented in overlay of electron density reconstructions (Fig. 2). The diameter of the fitted spheres is represented by a color map, ranging from 21 (blue) to 700 nm (red). Shown in d–f are enlarged versions of selected areas. Scale bars are 5 µm. g Thickness map-derived pore size distribution (PSD). h Radial number distribution of macro- and mesopores in FCC1, FCC2, and FCC3. Subvolumes extracted in Fig. 4 were analyzed in regard to the distribution of detectable meso- (<50 nm in diameter) and macropores (50–800 nm in diameter) as a function of fractional distance to the particle exterior. The smallest spheres considered in g, h were 31 nm in diameter slightly below the estimated spatial resolution

