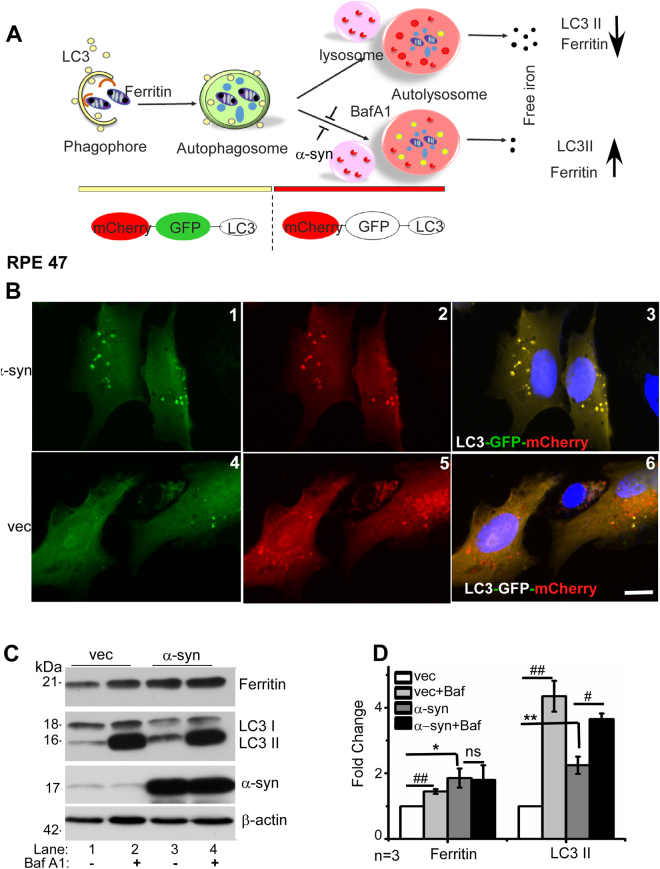
Figure 2.
α-Syn impairs lysosomal function in RPE cells: (A) When expressed in cells, LC3-GFP-mCherry provides a convenient way to monitor the fusion of LC3 positive autophagosomes with lysosomes. Both GFP and mCherry fluoresce at the neutral pH of autophagosomes, emitting a yellow color. Upon fusion with lysosomes, GFP is quenched due to low pH, while mCherry continues to fluoresce. Efficient fusion of autophagosomes with lysosomes will therefore result in mainly red fluorescence, and the expected degradation of LC3II and ferritin. A block in the fusion of autophagosomes with lysosomes or elevated pH of lysosomes, mimicked pharmacologically by BafA1, will not quench GFP, resulting in yellow fluorescence, and sparing of LC3II and ferritin. (B) Representative images of LC3-GFP-mCherry transfected RPE 47 cells stably overexpressing vector or α-syn show a yellow fluorescence in vesicular structures representing autophagosomes, and red fluorescence in lysosomes due to quenching of GFP at low pH. (C) Western blot image demonstrating expression of ferritin, LC3, α-syn, and β-actin in RPE cells overexpressing α-syn or vector following treatment with 100 µM BafA1 for 12 h. (D) Quantification by densitometry after normalization with β-actin. n = 3. Values represent mean ± SEM of the indicated n (*p < 0.05, **p < 0.01, #p < 0.05, ##p < 0.01). Asterisk (*) and hash (#) signs show comparison of untreated α-syn expressing cells with vector (*) and Baf A1 treated cells with untreated controls (#) respectively.

