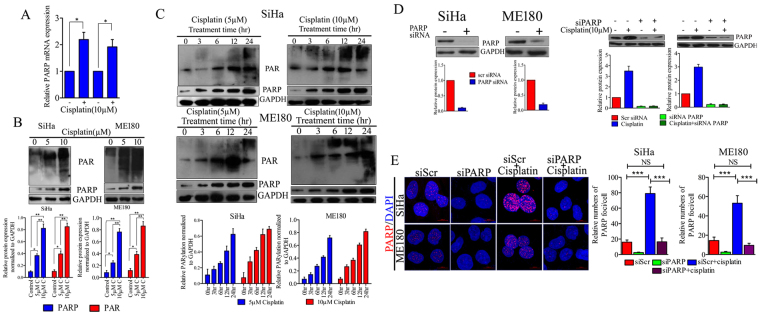
Figure 2.
Cisplatin induces PARP1 over expression and hyperactivation in CC cell lines. (A) Graph showing relative PARP1 mRNA expression in SiHa and ME180 CC cell lines after 24 hr cisplatin (10μM) treatment. (SiHa control vs. cisplatin *p = 0.0205, ME180 control vs. cisplatin *p = 0.0351). (B) Representative western blot showing expression of PARP1 and PAR polymers in SiHa and ME180 cell lines treated with 5 µM and 10 µM cisplatin for 48 hrs. Bar graph displaying normalized band density of PARP1 and PAR normalized to GAPDH. Error bar display the S.D. from the mean of 3 independent experiments. *p = 0.01,**p = 0.007. The full size blots corresponding to the cropped blot images are given in Supplementary Figure S12. (C) Western blot showing PARP1 and PAR expression in SiHa and ME180 cell lines treated with 5µM and 10µM for indicated time duration. Bar graph displaying normalized band density of PARP1 and PAR normalized to GAPDH band intensity of respective blot image. The full size blots corresponding to the cropped blot images are given in Supplementary Figure S12. (D) Transfection with specific PARP1 siRNA shows depletion in basal PARP1 protein level as well as cisplatin induced PARP1 overexpression. Bar graph displaying relative protein expression normalized to GAPDH. The full size blots corresponding to the cropped blot images are given in Supplementary Figure S12. (E) Representative immunofluorescence image showing nuclear localization of PARP1 in SiHa and ME180 cell lines. 24 hrs cisplatin treated cell shows enhanced number of PARP1 foci in both cell lines. Bar graph displaying quantitative distribution of PARP1 foci in respective treatment groups.

