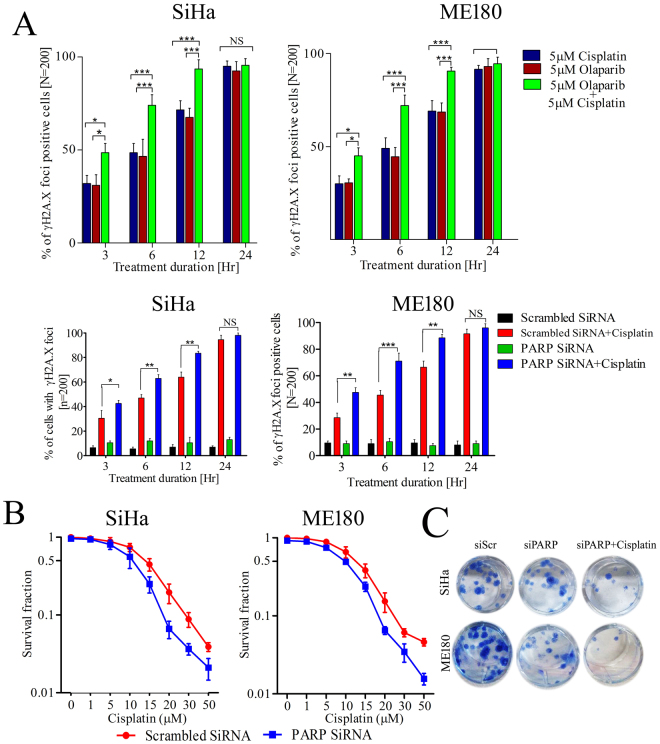
Figure 6.
PARP1 inhibition sensitizes CC cells and leads to rapid induction of DNA damage and cell death. (A) Bar graph showing the percentage of γH2A.X foci positive cells (cell with >20 positive foci/cell as compared to isotype) in indicated groups at particular treatment duration. At least 200 cells were counted in blind fashion in independent duplicate experiment. Error bar show SD from the mean of two independent counts. *p = 0.05, **p < 0.01, ***p < 0.001 (upper panel); Bar graph showing the percentage of γH2A.X foci positive cells in PARP1 silenced and control counterpart cells treated with 5 µM cisplatin for indicated time points. At least 200 cells were counted in blind fashion in independent duplicate experiment. Error bar display SD from the mean of two independent counts. *p = 0.05, **p < 0.01, ***p < 0.001 (lower panel). (B) Cell proliferation assay displaying effect of cisplatin on PARP1 silenced CC cells. (C) PARP1 silenced cells showing increased loss of clonogenic survival after cisplatin treatment in CC cells.

