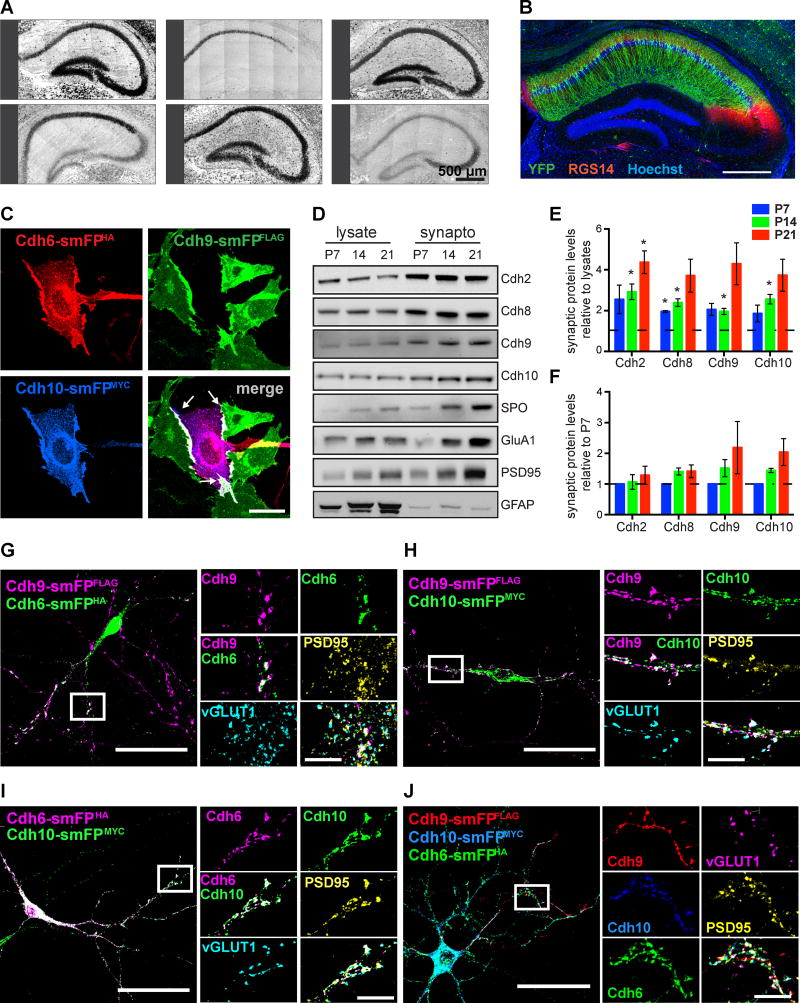
Figure 4. Cadherin-9 mediates trans-cellular adhesion via cadherins-6 and 10.
(A) In situ hybridizations of hippocampal cadherins. All images are tiled. (B) Immunostaining against YFP (green) and the CA2 marker RGS14 (red) in hippocampus from Cdh10-CreERT2+/−;Ai3+/− mice injected with tamoxifen. Hoechst (blue) labels all cell nuclei. (C) CHO cells expressing Cdh9-smFPFLAG (green) were mixed with cells co-expressing Cdh6-smFPHA (red) and Cdh10-smFPMYC (blue). Note that cadherins-6, 9, and 10 co-cluster at the interaction interfaces (white arrows in the merged image). (D) Immunoblots show cadherins-9 and 10 are enriched in hippocampal synaptosomes from P7, P14, and P21 mice. Samples were also probed for cadherins-2 and 8, the presynaptic marker synaptoporin (SPO), the postsynaptic markers PSD95 and GluA1, and a nonsynaptic marker GFAP. (E) Quantification of synaptic enrichment of each indicated cadherin relative to their levels in lysate at each time point. For each time point, a one sample t-test was used to determine if the mean enrichment value is significantly different than 1 (depicted as the dotted line), which would denote no enrichment. (F) Quantification of cadherin levels in synaptosomes over time. Each protein is normalized to its level in synaptosomes at P7. Statistical difference between means were calculated using one-way ANOVA (performed on each cadherin separately) followed by pairwise Holm-Šidák multiple comparison tests. For Figures E and F, 3 independent experiments were done for each age with hippocampi from 3–4 animals pooled per experiment. (G–J) Cultured neurons expressing Cdh9-smFPFLAG were plated with neurons expressing either Cdh6-smFPHA, Cdh10-smFPMYC, or both Cdh6-smFPHA and Cdh10-smFPMYC. Neurons were immunostained for epitope tags to label cadherins and vGLUT1 and PSD95 to label pre- and postsynaptic sites. Boxed regions are shown magnified at right and arrowheads indicate points of co-localization at synapses. All data shown as mean ± s.e.m. All fluorescent images are composite and each channel is indicated.

