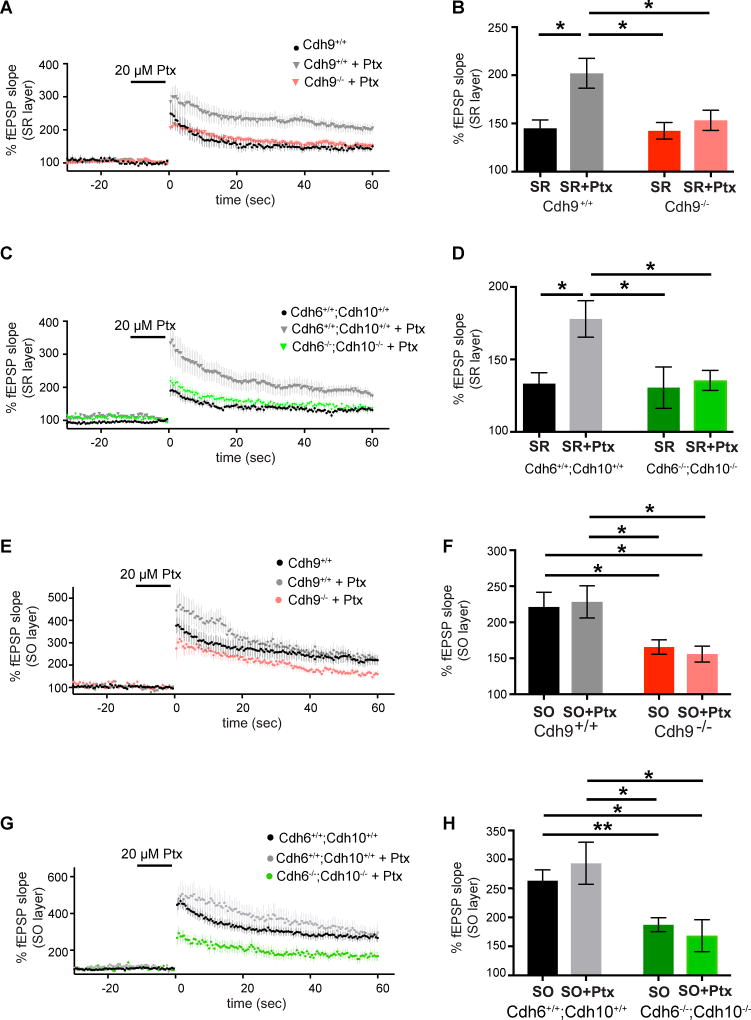
Figure 7. Cadherins-6, 9, and 10 are required for picrotoxin-induced high magnitude LTP in SR.
(A–B) Time course (A) and mean LTP magnitude comparison (B) of SR LTP recorded from Cdh9 wildtype and knockout mice with and without 20 µM picrotoxin (Ptx). n=9–16 slices, each from 3–5 animals aged 3–5 months. (C–D) Time course (C) and mean LTP magnitude comparison (D) of SR LTP recorded from Cdh6/Cdh10 wildtype and double knockout mice with and without 20 µM picrotoxin (Ptx). n= 10–15 slices, each from 3–6 animals aged 3–5 months. (E–F) Time course (E) and mean LTP magnitude comparison (F) of SO LTP recorded from Cdh9 wildtype and knockout mice with and without 20 µM picrotoxin (Ptx). n=8–17 slices, each from 3–5 animals aged 3–5 months. (G–H) Time course (G) and mean LTP magnitude comparison (H) of SO LTP recorded from Cdh6/Cdh10 wildtype and double knockout mice with and without 20 µM picrotoxin (Ptx). n=8–32 slices, each from 3–11 animals aged 3–5 months. Statistical differences were measured using two-way ANOVA followed by pairwise p-value calculation using Holm-Šidák multiple comparison test. Two-way ANOVA p-values are reported in supplementary table 2. p<0.05, p<0.01, p<0.001, and p<0.0001 is denoted by *, **, ***, and **** respectively, otherwise p>0.05. All data shown as mean ± s.e.m. Note: untreated wildtype and knockout data without Ptx is the same data reported in previous figures and shown here again for comparison with Ptx treatment.

