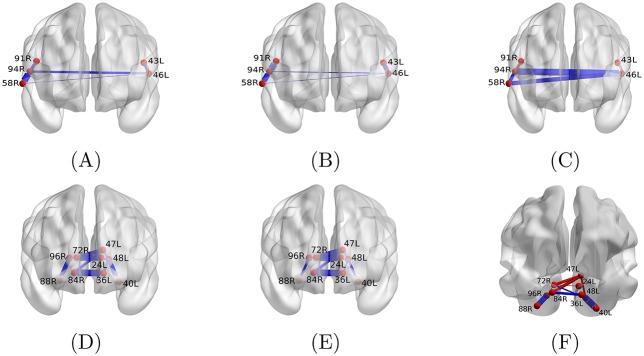
Fig 4. Average coherence of edges between high- and low-rate learning sessions in the two biomarker regions.
Edge thickness encodes the average coherence in high (A), (D) and low (B), (E) learning rate sessions, as well as the absolute difference between the averages (C), (F). Furthermore, the blue color in (C), (F) designates the average high-rate learning coherence being larger than that of low-rate learning and the red color shows the opposite case. Mapping of all brain region ids to anatomical names is provided in S1 File.

