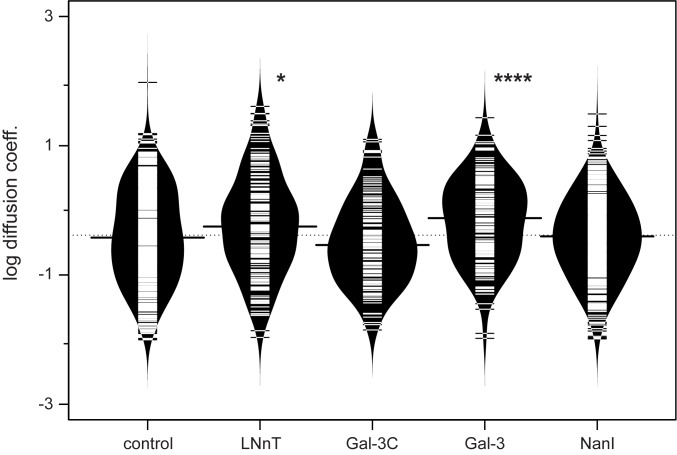
Fig 1. Lateral mobility of integrins is modulated by the presence of saccharides and lectins.
The lateral mobility of integrins were determined using SPT, and the data from Table 1 are shown. Each sample population is shown as a bean plot,[87] with the logarithmic median of the diffusion coefficients indicated by a solid line for each population.[87] Each population is shown with a density estimate and horizontal lines indicate individual diffusion coefficient measurements. Gal-3C and Gal-3 treatments are shown for 50 μg mL-1 concentrations. Diffusion coefficients are given as log(D), where D is in units of x 10−10 [cm2s-1] or x 10−2 [μm2s-1]. Data were compared to a PBS control using a student’s t-test to determine p values; *, p ≤ 0.05; **, p ≤ 0.01; ***, p ≤ 0.005; ****, p ≤ 0.0001.

