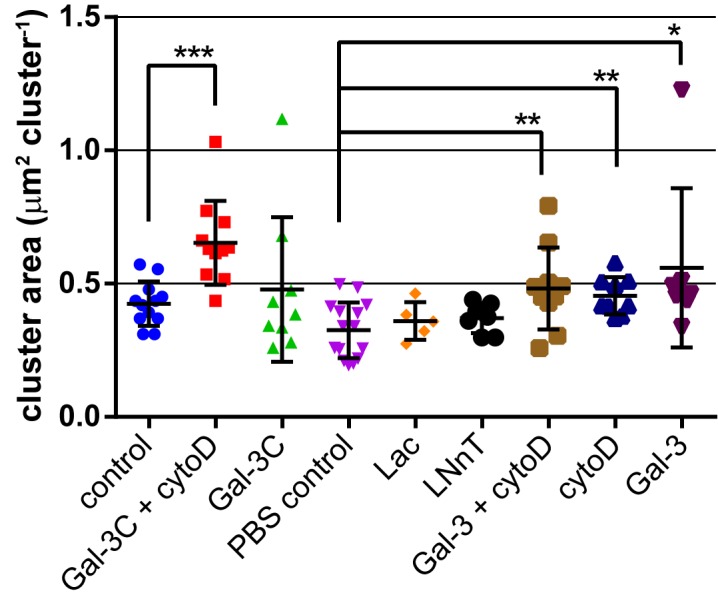
Fig 2. Clustering of integrins is increased on Gal-3 treated cells.

Cells were stained using the same anti-α5-Cy5 conjugate employed for tracking experiments. Ten fields of stained cells were analyzed using ImageJ to identify clusters and measure their size. Treatment with Gal-3 resulted in an increase in the size of integrin clusters. See Table B and Figure A in S1 File. Data were compared to a PBS control, or PBS containing BME (control) using a student’s t-test to determine p values; *, p ≤ 0.05; **, p ≤ 0.01; ***, p ≤ 0.005; ****, p ≤ 0.0001.
