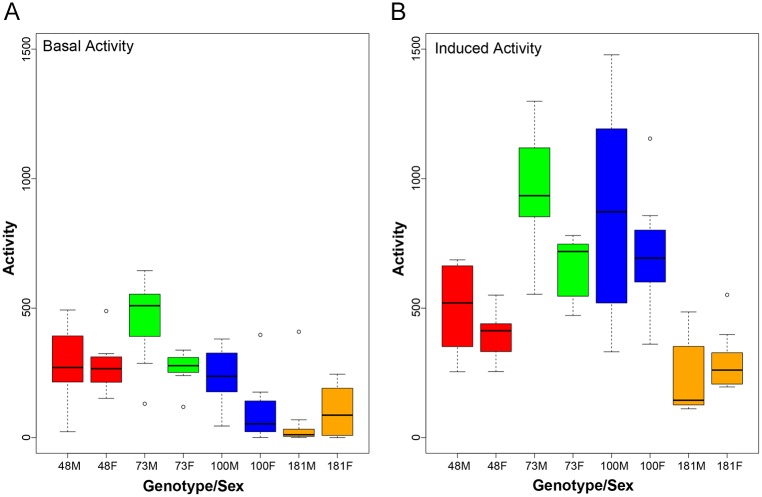
Fig 2. Rotation on the REQS induces exercise as measured by increased activity levels.
Activity levels were assessed as the number of laser crossings for four DGRP2 lines separately from male and female flies in an unstimulated environment (A) and with rotation (B). 10 vials with 10 flies each were examined for each genotype-sex combination. The Y-axis shows activity levels as cumulative number of laser crossings detected per vial per one hour, while the X-axis shows the genotype and sex of the flies (M: male; F: female, with the number referring to the DGRP2 line). The box indicates the interquartile range, while the lines above and below indicate the maximum and minimum respectively. The middle line indicates the median and dots represent outliers.

