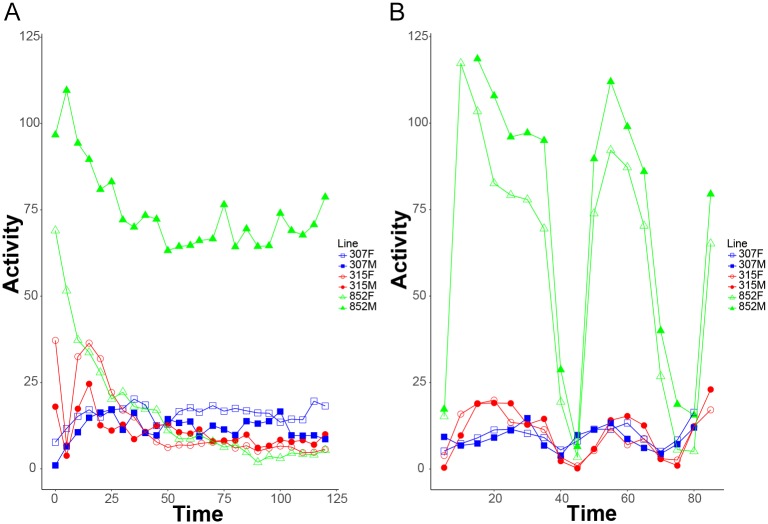
Fig 4. The REQS can detect differences in activity levels between different exercise regimes.
Activity of flies from three lines was recording, either during a continuous 2 hour exercise period (A) or during an interval training method (30 minutes exercise, 10 minutes rest, 20 minutes exercise, 10 minutes rest, 10 minute exercise; B). 10 vials with 10 flies per vial were recorded for each genotype and treatment (n = 10). The chart is designated as follows: 307 = blue squares, 315 = red circles, 852 = green triangles, females = open shapes, males = filled shapes. The Y-axis shows mean activity measured as laser crossings per 5-minute interval, and the X-axis shows time in minutes.

