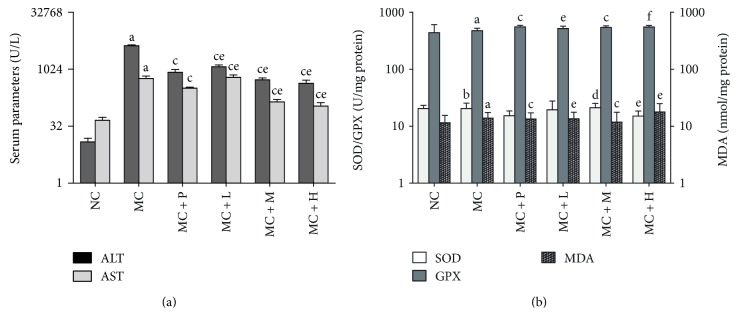
Figure 3.
Levels of several serum and liver biological indexes of mice for a consecutive 4-week experiment. Values are expressed as the mean ± SD of 6 mice in each group. aP < 0.01, compared with the NC group. bP < 0.05, compared with the NC group. cP < 0.01, compared with the MC group. dP < 0.05, compared with the MC group. eP < 0.01, compared with the MC + P group. fP < 0.05, compared with the MC + P group.

