Figure 4.

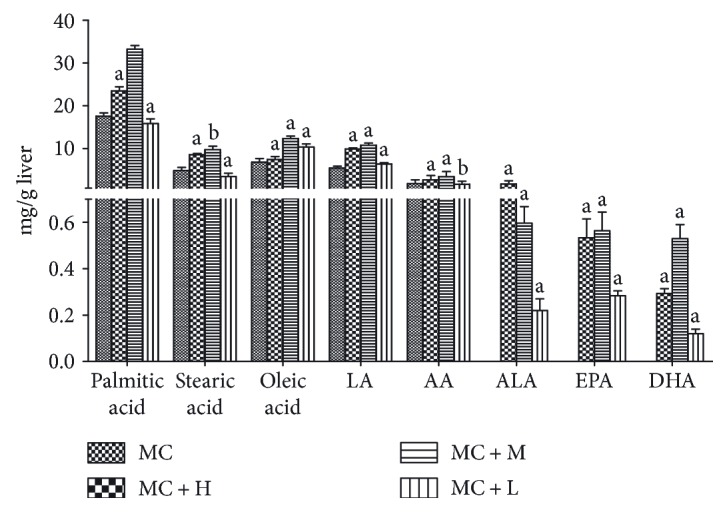
Fatty acids present in mouse livers. Values are expressed as mean ± SD (n = 6). aP < 0.01, compared with the MC group. bP < 0.05, compared with the MC group.

Fatty acids present in mouse livers. Values are expressed as mean ± SD (n = 6). aP < 0.01, compared with the MC group. bP < 0.05, compared with the MC group.