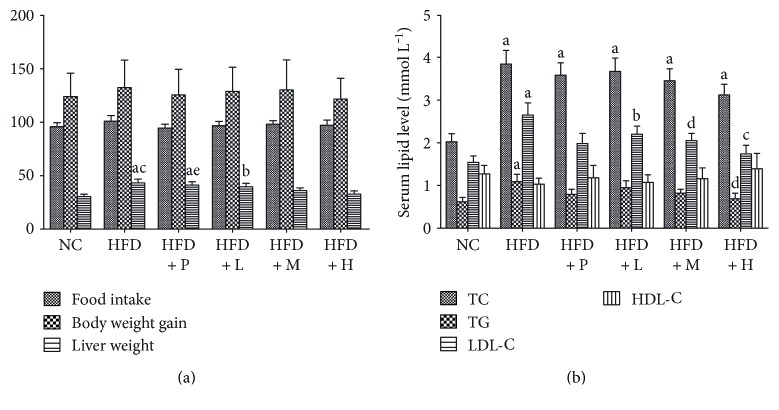
Figure 5.
The levels of food intake, body weight gain, liver weight, and serum lipid profile of different feeding groups for a consecutive 30-day experiment including NC (normal diet), HFD (high-fat diet), HFD + P (Xuezhikang, 120 mg kg−1 d−1), HFD + L (PSO, 1.0 g kg−1 d−1), HFD + M (PSO, 2.5 g kg−1 d−1), and HFD + H (PSO, 6.0 g kg−1 d−1). Data were expressed as mean ± SD (n = 6), and means with different letters were different at the P < 0.05 level. Different lowercase letters indicated differ significantly (P < 0.05). aP < 0.01, compared with the NC group. bP < 0.05, compared with the NC group. cP < 0.01, compared with the HFD group. dP < 0.05, compared with the HFD group. eP < 0.05, compared with the HFD + P group.

