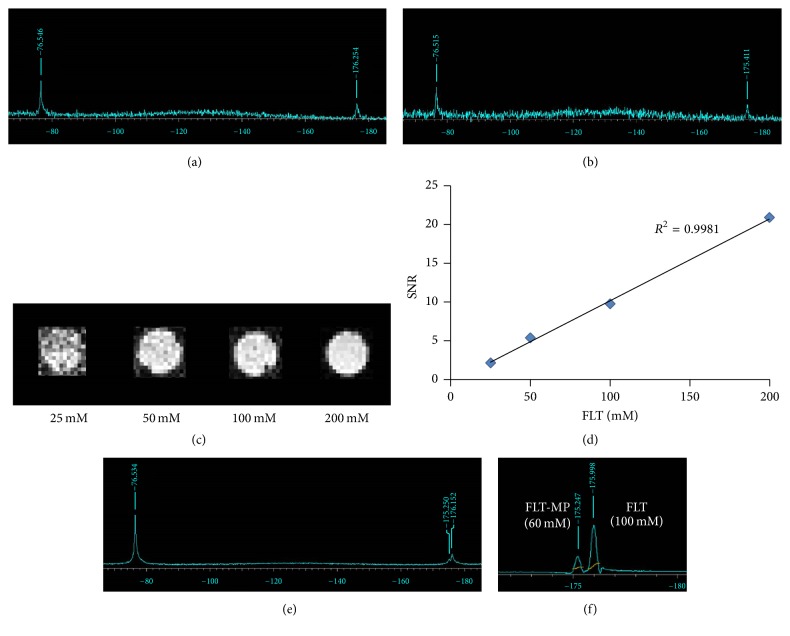
Figure 2.
Typical coil-localized 19F spectra of (a) FLT and (b) FLT-MP containing TFA as a reference. (c) 19F MR images of phantoms containing 25, 50, 100, and 200 mM FLT. (d) Signal intensity in 19F MR images of FLT phantoms, as a function of FLT concentration (R2 = 0.998). (e) Typical coil-localized 19F spectrum of a phantom containing a mixture of FLT (100 mM) and FLT-MP (60 mM). (f) 19F MRS spectrum of a phantom containing a mixture of FLT (100 mM) and FLT-MP (60 mM). The area ratio of FLT (100 mM) to FLT-MP (60 mM) is approximately 100 to 60.

