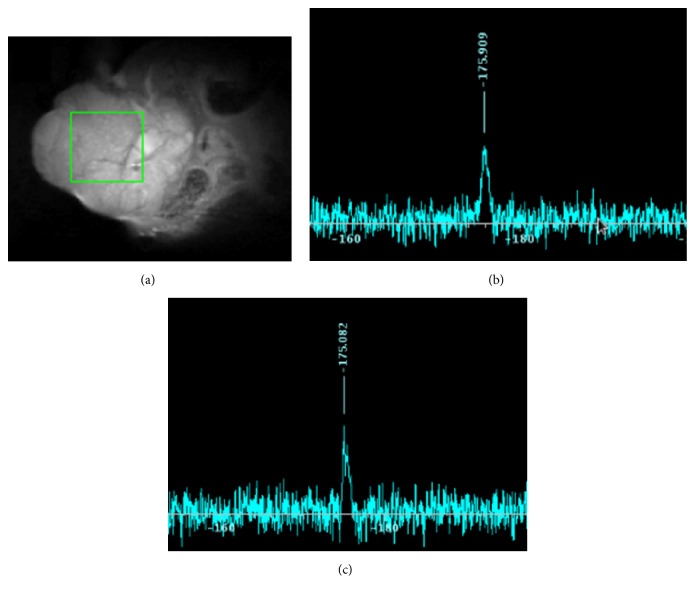
Figure 5.
In vivo 19F MR spectrum in a mouse tumor model. FLT (200 mM, 100 μL) was injected into tail veins. (a) Anatomical 1H MR images of the mouse were obtained using fast spin echo sequence with the voxel of interest in the tumor (5 × 5 × 5 mm3). Time-course of 19F MR spectra at (b) 25 min after injection (a.i.) (−175.9 ppm) and (c) 90 min a.i. (−175.08 ppm). 19F MRS data were acquired with Point-REsolved Spectroscopy (PRESS) using TR 3000 ms, TE 15 ms, averages 512, scan time 25 min.

