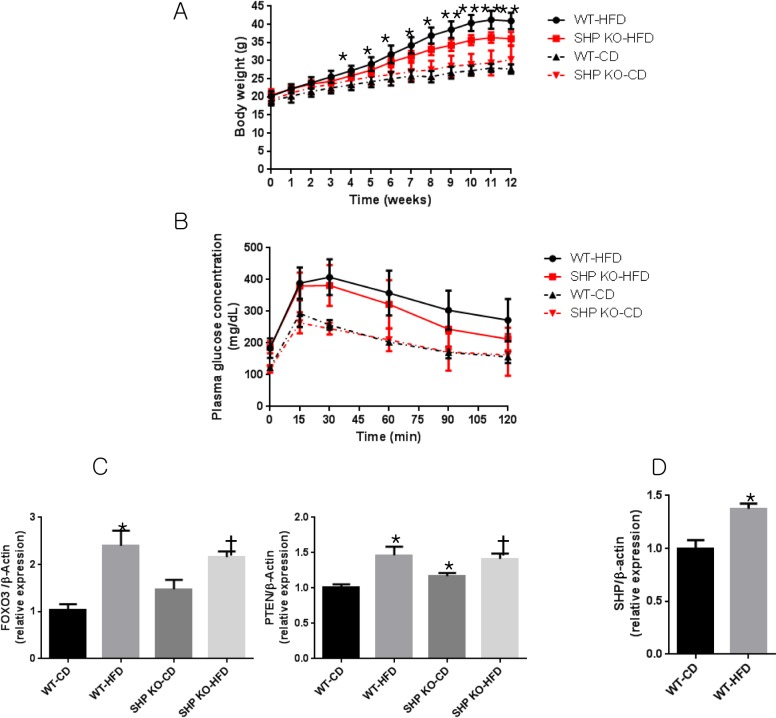
Fig 3. Glucose tolerance and changes in insulin resistance-related genes in the myocardia of WT and SHP KO mice after 12 weeks of HFD feeding.
(A) Growth curves in mice. *p < 0.05, ** p < 0.001. (B) Intraperitoneal glucose tolerance tests (IPGTTs) (2 g D-glucose per kg body weight) were performed in 17- to 18-week-old male mice. (C) Relative expression of insulin signalling-related genes FOXO3 and PTEN. n = 5–8 per group; * p < 0.05 compared to CD WT mice, † p < 0.05 compared to CD SHP KO mice. FOXO3, forkhead box O3; PTEN, phosphatase and tensin homolog. (D) Relative expression of SHP in WT mice myocardia. n = 5–8 per group; * p < 0.05 compared to CD WT mice.

