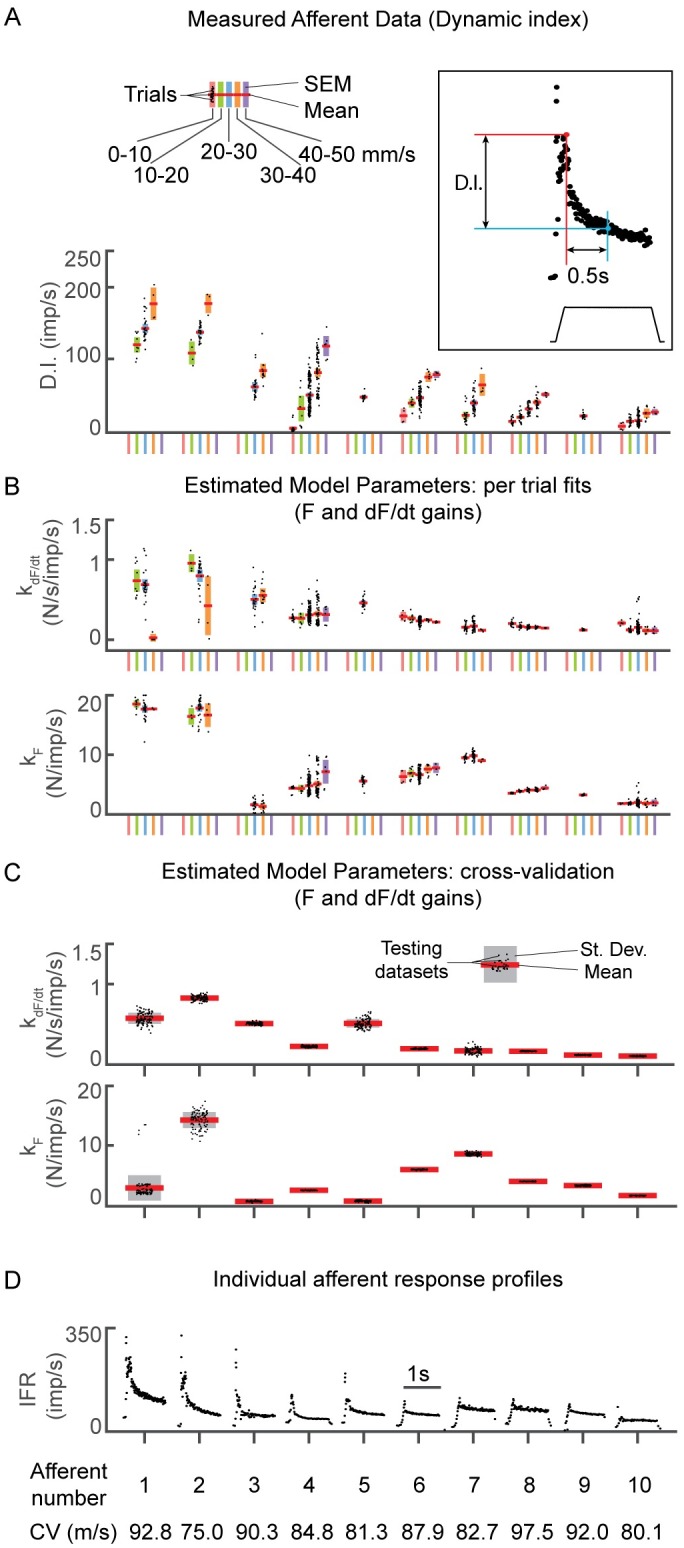
Fig 5. Single muscle spindle afferent statistics and model parameter estimates.

(A) Dynamic index measured for each ramp-and-hold stretch trial for every afferent, organized in descending order from left to right. For the 10 afferents analyzed, stretch trials were separated based on the velocity (indicated by colors) imposed on the muscle for that trial (divided into 5 10 mm/s velocity bins ranging from 0–50 mm/s). Bins with fewer than 4 trials were excluded from this figure. Horizontal red lines represent the mean, the colored bars represent the standard error of the mean (SEM), and the black dots represent individual trial values. (B) In contrast to DI, force-related model weights were relatively constant with increasing stretch velocity. The color scheme is the same as in A. The upper plot is model weight on dF/dt and the lower plot is the model weight on force. (C) Force-related model weights and distributions for 100 randomized testing datasets (fitting one set of parameters for the entire dataset) for each afferent. For each afferent, a range of stretch perturbations (e.g. varying length, velocity, acceleration and stretch type) were included in the testing dataset. Red lines represent the means, grey bars represent standard deviations, and the black dots represent values for each testing dataset. As in B, model weights on dF/dt are shown in in the upper plot and model weights on force are shown in the lower plot. (D) Responses to a ramp-and-hold stretch at 3mm hold length, and 20mm/s stretch velocity for each afferent. Bottom row indicates conduction velocity for each afferent included in this analysis.
