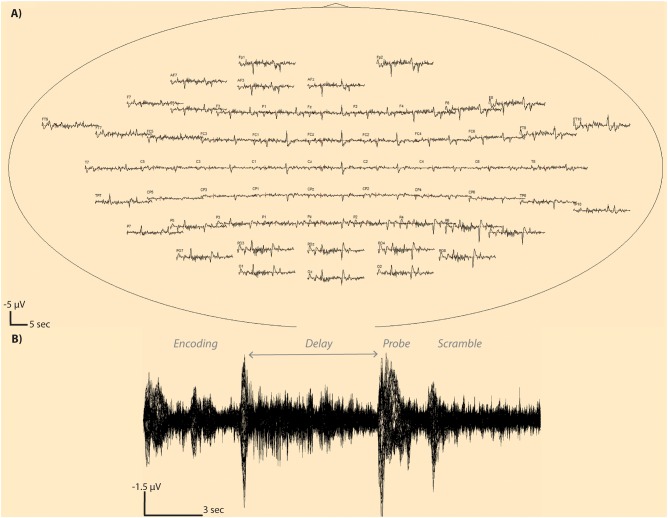
Fig 3. Averaged whole trial window EEG traces.
An average EEG trace is shown at each sensor (a) for a single subject with 94 trials surviving artifact detection. Electrode T7 is shown in zoomed view (b) showing superimposition of all 94 trial EEG traces from the beginning to end of the time window. Note that a negative potential is an upward deflection in these plots.

