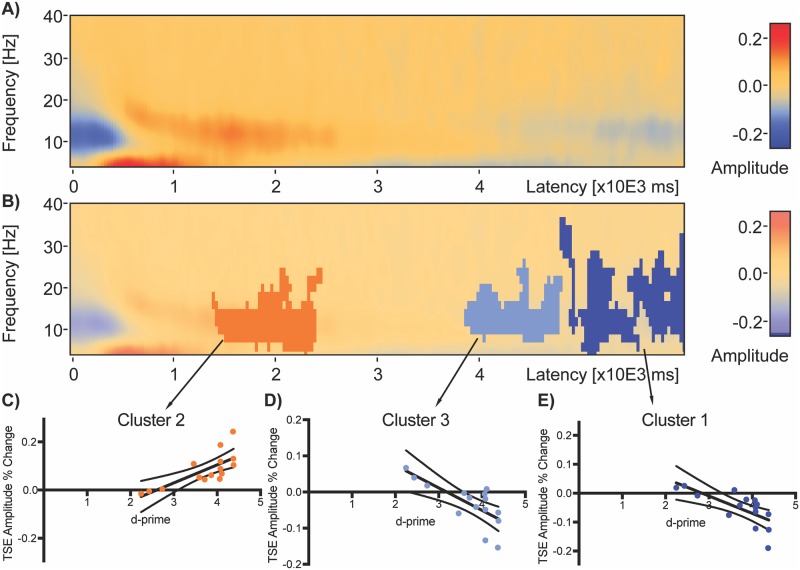
Fig 5. Average delay window TSE and significant clusters of correlation with performance across all subjects.
Average delay period TSE plot (computed using whole delay window as baseline) with no statistical significance overlay (a) shows initial negative change from 6 to 28 Hz at the start of the delay period 0 to 600 ms. Weak positive change (red) is then present from around 500ms to 2925 ms at 6–26 Hz. Stronger positive change is present in the 4–8 Hz from around 275 ms to 1650 ms. A switch to negative change (blue) is present from approximately 4125 ms to the end of the delay period in the 8–26 Hz range and from 2500 ms to 5475 ms in the 4–8 Hz range. Correlation of TSE with subject d-prime revealed three significant clusters (b) in descending order from most significant. Significant clusters are represented by darker shades of red or blue overlaid on TSE activity. Cluster 1 (c, latency 4775–6000 ms and frequency range 4–36 Hz) and Cluster 3 (d, latency 3850–4800 ms and frequency range 4–24 Hz) were negatively correlated with d-prime (Cluster 1: Cluster Value = -993.061, p = .017; Cluster 3: Cluster Value = -640.877, p = .032) and Cluster 2 (e, latency 1400–2450 ms and frequency range 4–24 Hz) was positively correlated with d-prime (Cluster Value = 665.685, p = .022). Dark black lines on the graphs (c-e) are linear regression fits and dotted lines are 95% confidence intervals.

