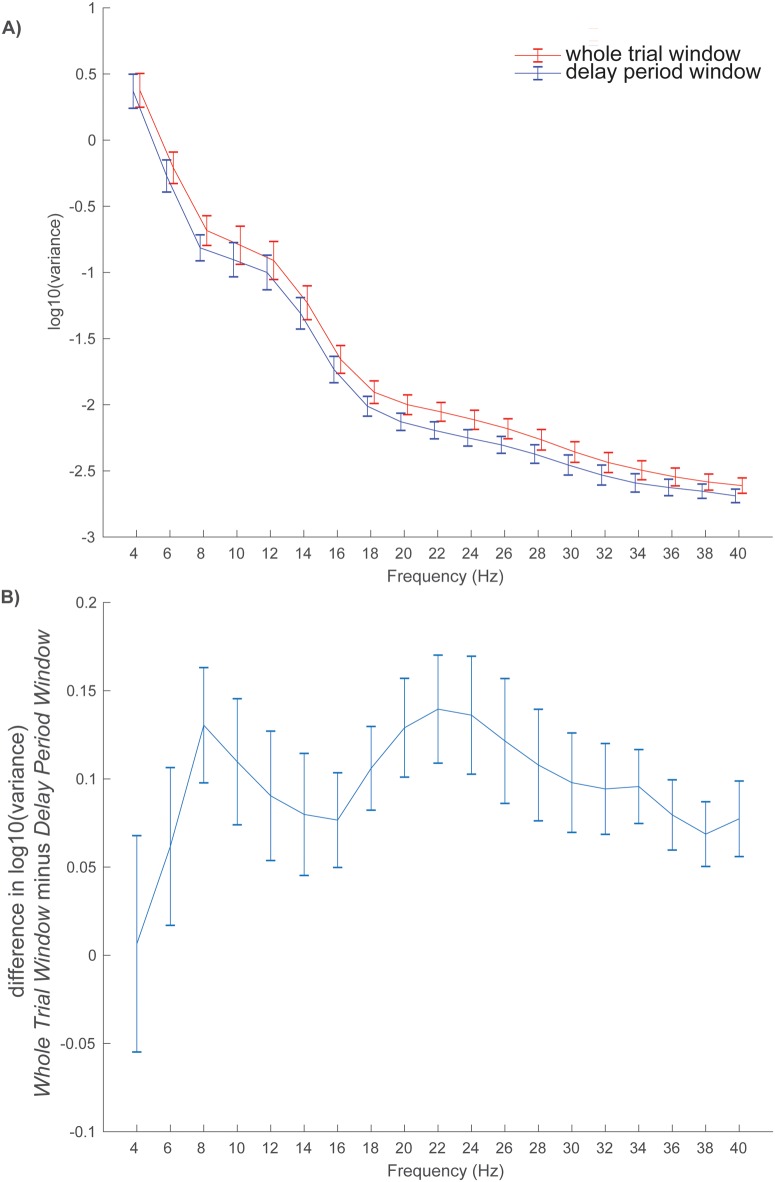
Fig 9. Variance as a function of analysis window and frequency bin.
The log10 raw amplitude variance (normalized by the N-1 samples) was computed for each subject within two windows—the whole 17 sec trial window (red line) and the 6 sec delay period (blue line)–and plotted as a function of frequency (a). Subject differences in log10 raw amplitude variance (whole trial window minus delay period window) are plotted as a function of frequency (b) and show that whole trial window variances are larger than delay period variances in the range between 6 and 40 Hz, with local peak differences occurring at 8 Hz and 22 Hz. Error bars are subject standard errors of the mean.

