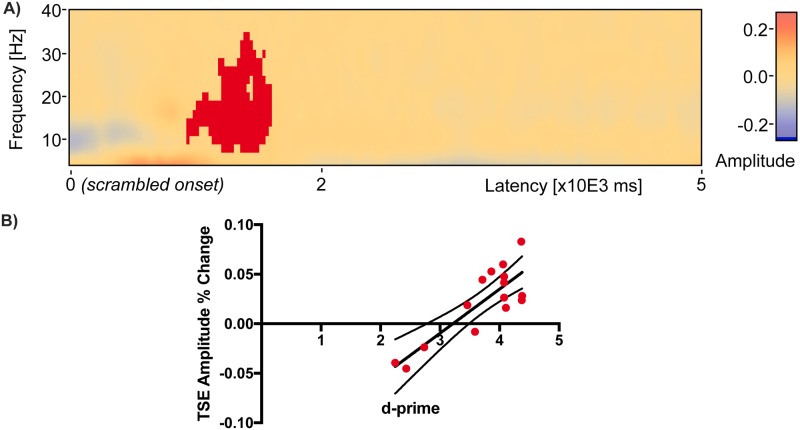
Fig 10. A significant cluster of TSE-performance correlation in the scrambled period.
During the 5 second scrambled scene period after probe presentation there was a cluster of positive correlation found between TSE amplitude and d-prime (red, Cluster Value = 660.673, p = 0.017) between 900 ms and 1600 ms after the onset of the scrambled scene (a). Individual subject amplitudes expressed as change relative to the mean across the 5 sec scrambled period are plotted as red filled dots with dark line indicating linear regression fits and boundary lines indicating 95% confidence intervals (b).

