
Fig 3.
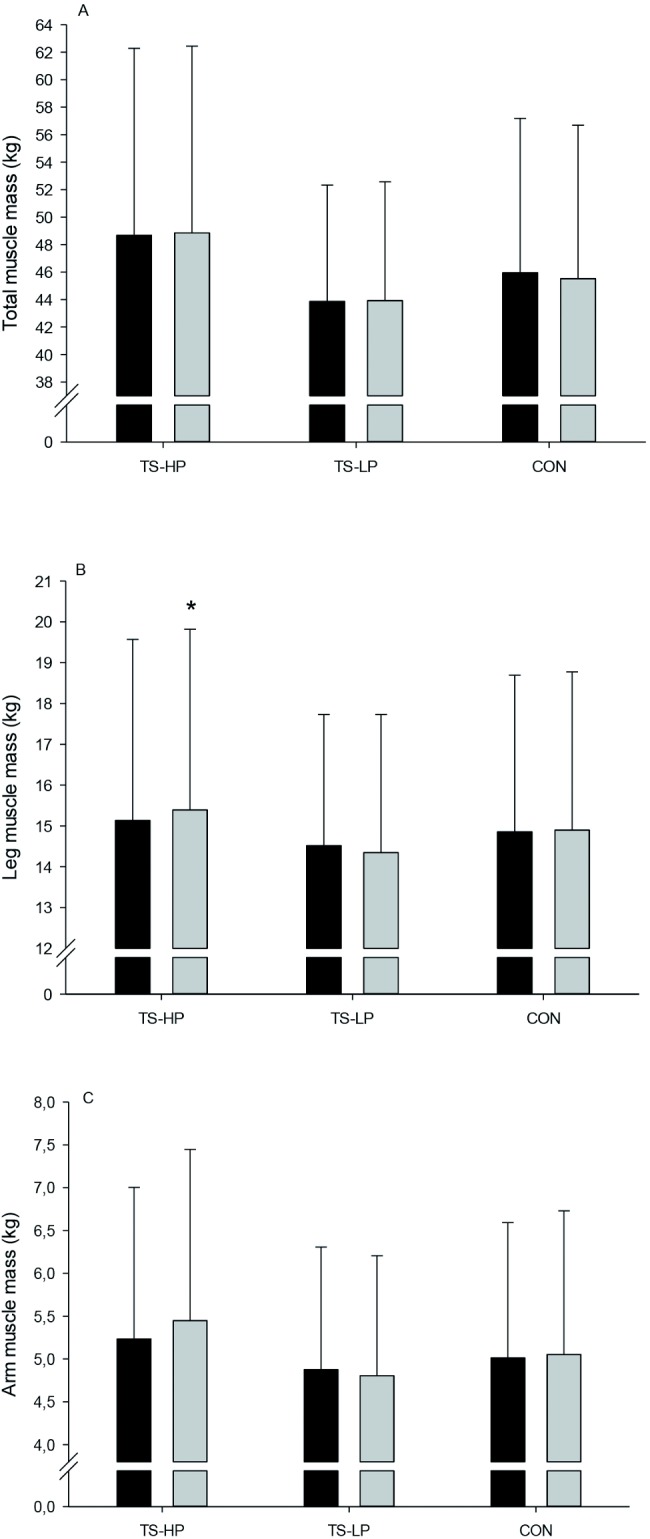
Total muscle mass (A), leg muscle mass (B), and arm muscle mass (C) before (black bars) and after (grey bars) the 12-week intervention period for the team sport and high protein (TS-HP, n = 13), team sport and low protein (TS-LP, n = 18) and the control group (CON, n = 17). Data are presented as means ± SD. *Significant effect compared to CON, based on the ANCOVA model with adjustment for baseline outcome, age and gender.