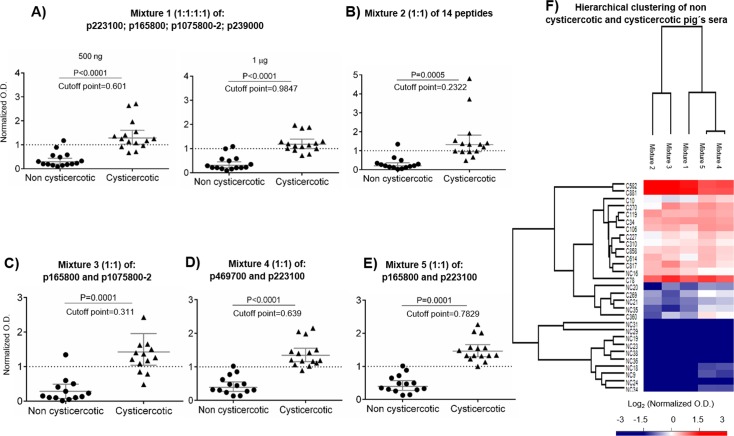
Fig 8. Peptide mixtures as potential diagnostic agents for Taenia solium cysticercosis.
Several peptide mixtures were used: A) The best four individual peptides (using 500 ng or 1 μg to coat each microtiter plate well). The rest of the peptides combinations were used at 500 ng. B) Mixture of all 14 peptides synthesized in this study, C) Mixture of the peptides derived of skeletal muscle (SM) abundant proteins, D) Mixture of one peptide of a central nervous system (CNS) abundant protein and one of a constitutive protein and E) Mixture of peptides from SM and CNS cysts. The normalized optical density was calculated by dividing each individual O.D. by the cut-off value (mean value of non cysticercotic pigs plus two standard deviations). P-values are shown at the top of each figure. F) Heat map showing the individual response to antigenic peptide mixtures. The normalized optical density was transformed using Log2. White represents values near to the cut-off point, red represents values over the cut-off point (positive samples) and blue represents values below the cut-off point (negative samples).

