
Figure 2. Variation in 25-hydroxyvitamin D (25[OH]D) levels by month and year of collection.
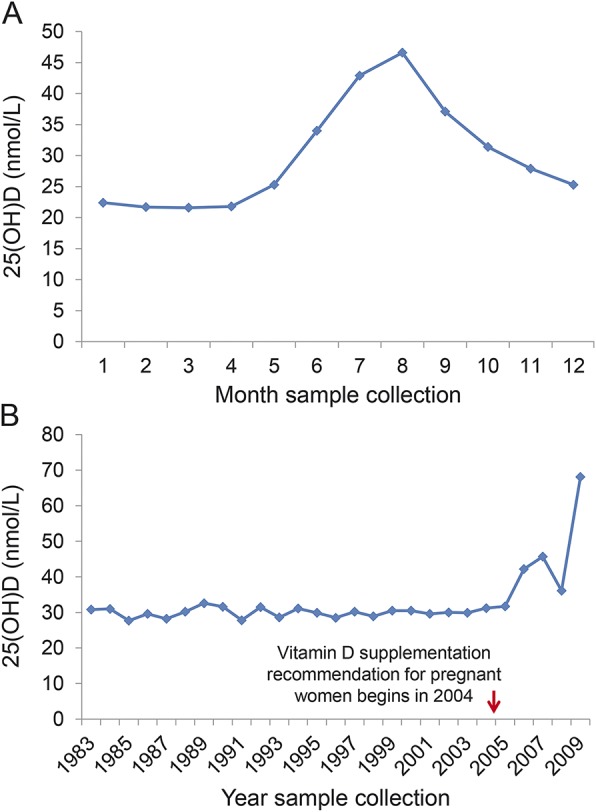
(A) Variation in 25(OH)D levels by month of serum sample collection. (B) Average 25(OH)D levels by calendar year of sample collection. *Only 1 sample collected in 2009.