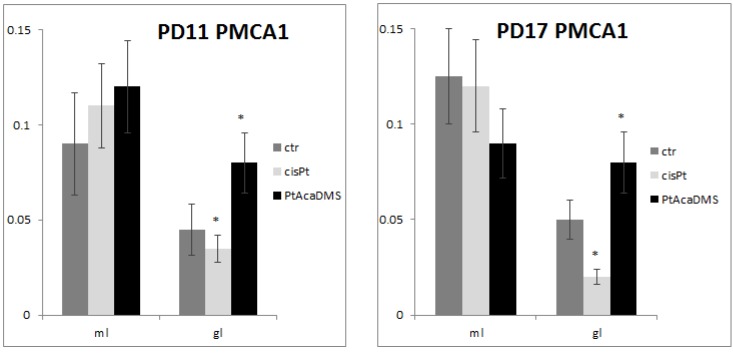
Figure 4.
PMCA1 immunocytochemistry in the DG granule cell layer. Histograms show the OD values and the significance of differences is reported (* p<0.05). At PD11, the intensity of labelling decreases after cisPt and increases after PtAcacDMS. At PD17, decreased immunolabelling intensity is found after cisPt, while increased intensity is present after PtAcacDMS. ml: Molecular layer; gl: Granule layer.

