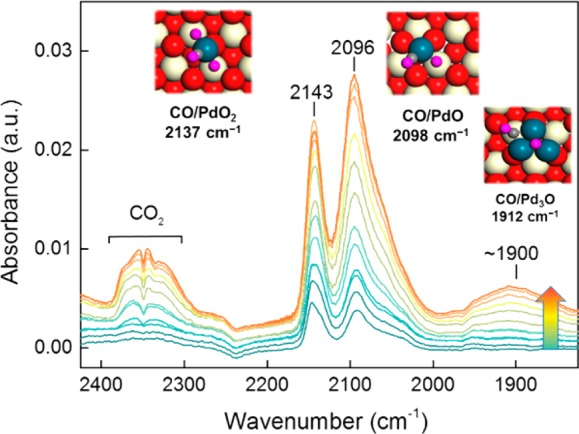
Figure 3.

IR spectra of incremental doses of CO on the Pd/CeO2-rod catalyst at 50 °C. The catalyst was previously in situ calcined at 300 °C, cooled to 50 °C in an O2-atmosphere followed by lowering the O2 pressure to 2 mbar followed by CO pulses. The inserts show DFT-optimized structure of CO on different Pd configuration on CeO2(111) (color scheme: red, surface O; orange, subsurface O; white, surface Ce; pink, O of adsorbed species; blue, Pd).
